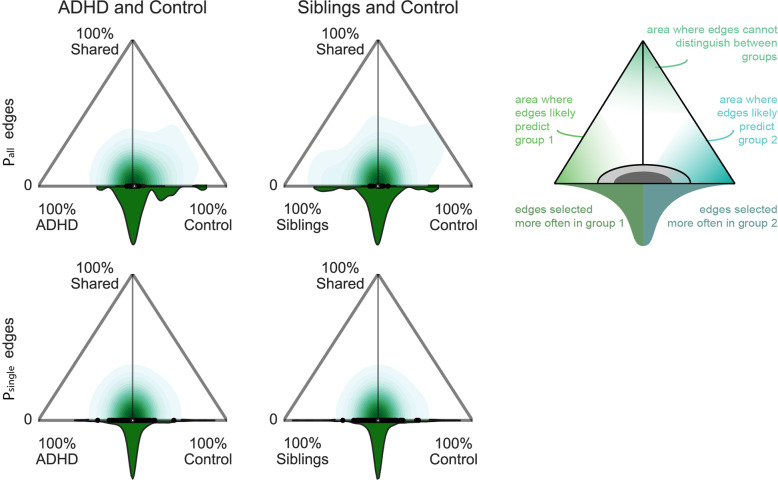
Fig. 2. Comparison of selection reliability across bootstraps.
By investigating the reproducibility of the selection of connections across bootstraps for each group and connections, we inferred on the uniqueness (x-axis) and shareability (y-axis) of each connection between two groups. Y-axis represents the percentage of bootstraps in which a connection is selected in two groups as a common or task specific connection, relatively. X-axis represents the difference between groups in percentage of selection across bootstraps of a connection as Pall or Psingle edges. A connection that was always selected in both groups, i.e. high shareability, shown at the top corner of each triangle, would represent a connection that cannot be used to differentiate between those two groups. A connection that was always selected in one group only, located in the lower corners of the triangles, would be unique to a group and could be used to predict the group. Connections that would be heterogeneously selected in the population would have a low uniqueness (around 0 on the x-axis) and a low shareability (bottom of y-axis). The distribution at the basis of the triangle informs about the density of connections represented in the triangle, i.e. the spread of the distribution indicates whether only a small subset or a larger representation of connections are most often selected in one group relatively to the total amount of selected connections.

