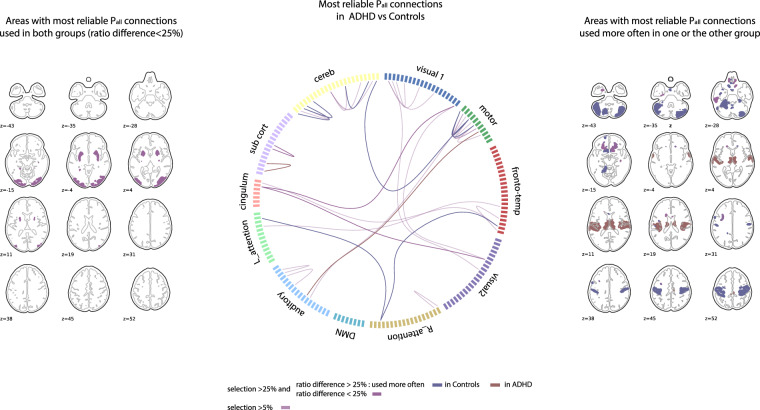
Fig. 3. Representation of areas with most reproducible Pall connections comparing ADHD and Control groups.
The brain slices on the left show areas with at least one connection used reproducibly (>50% of selection and ratio difference <25%) in both groups. The circular connectivity plot represents all connections selected >50% as Pall in one of the two compared groups across bootstraps. Within these strongly reproducible Pall connections, the ones used most often in one group are represented with full color of that group (ratio difference >25%) (red for ADHD, blue for Controls). The brain slices on the right represent the brain areas associated to the connections used more often in one group. If an area has connections used in each group, its color is a blend of the compared group colors (purple).

