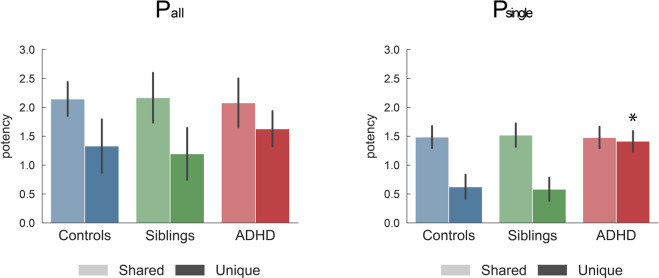
Fig. 4. Modulation of edges.
The graphs quantify the average task potency across unique or shared connections for each group and connection type (corresponding to the third line in Fig. 1). All reported values show the average and standard deviation across 10,000 independent bootstraps. Indicated P values show significant differences after FDR correction. Full results are available in Tables S3 and S7. Replication of these findings in light of possible confounding effects (scanner, gender, medication, comorbidity, age, IQ) is available in Figs. S1 and S2.

