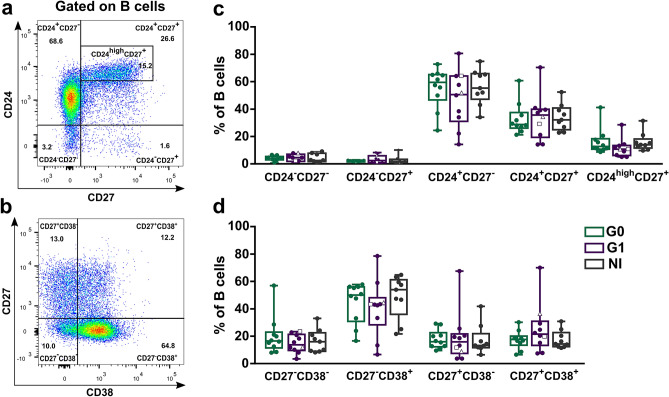
Figure 2.
Frequency of B cell subsets based on CD24 and CD27 or CD27 and CD38 markers expression in peripheral blood from CCD patients and non-infected donors. (a,b) Representative dot plots from a non-infected donor showing the gating strategy used to determine the subsets within total B cells according to the combined expression of CD24 and CD27 or CD27 and CD38. (c,d) Frequency of B cell subsets in CCD patients (G0, G1) and non-infected donors (NI). Each dot represents data from one subject; inside G1 group, solid circles correspond to K1 patients, hollow triangle to K2 patient and hollow square to K3 patient. Boxes and whiskers show median value and interquartile range.

