Figure 3.
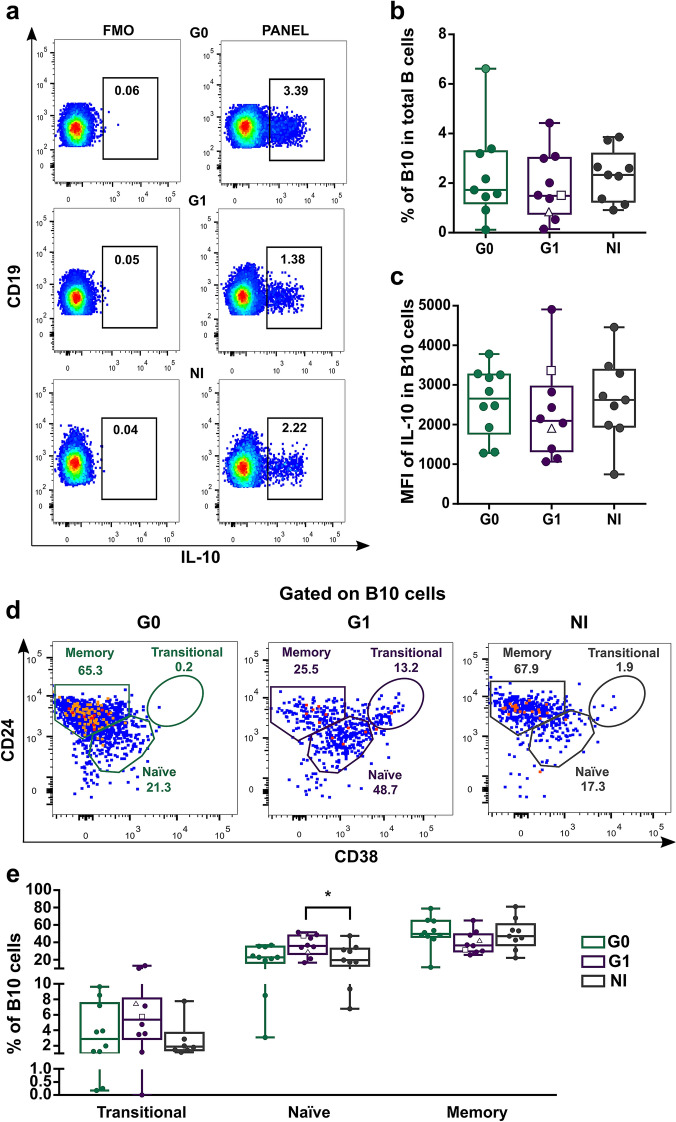
Frequency and phenotypic distribution of B10 cells according to CD24 and CD38 expression in peripheral blood from CCD patients and non-infected donors. (a) Representative dot plots showing the gating strategy used to determine the IL-10+ B cells (B10 cells) in PIB stimulated PBMC. Fluorescence minus one controls (FMO) were used to define the negative populations for each sample. (b,c) Frequency of B10 cells in total B cells and mean fluorescence intensity (MFI) for IL-10+ in B10 cells in CCD patients (G0, G1) and non-infected donors (NI). (d) Representative dot plots showing the gating strategy used. IL-10 expressing B-cells (B10 cells) were gated according to subject- and condition-matched FMO control tubes and were further sub-gated using CD24 and CD38 to identify the phenotypical distribution of these populations. (e) Frequency distribution of B10 cells according to CD24 and CD38 expression in CCD patients (G0, G1) and non-infected donors (NI). Each dot represents data from one subject; inside G1 group, solid circles correspond to K1 patients, hollow triangle to K2 patient and hollow square to K3 patient. Boxes and whiskers show median value and interquartile range. Statistically significant differences among groups are indicated (*p < 0.05).

