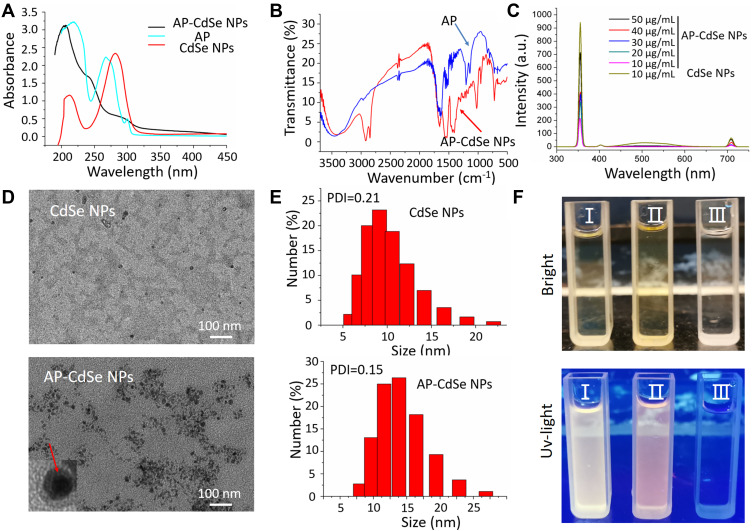
Figure 1.
Characterization of AP-CdSe NPs. (A) UV–vis absorption spectra of AP, CdSe NPs and AP-CdSe NPs. (B) Infrared spectra of AP and AP-CdSe NPs. (C) Fluorescence emission spectra of AP-CdSe NPs at various concentrations (10, 20, 30, 40 and 50 µg/mL) and CdSe NPs (10 µg/mL). (D) TEM images of CdSe NPs and AP-CdSe NPs. (E) DLS of CdSe NPs and AP-CdSe NPs. In the inset, the red arrow points to a AP coated CdSe NPs. (F) Digital images of CdSe NPs (I) and AP-CdSe NPs (II) under bright and UV light.

