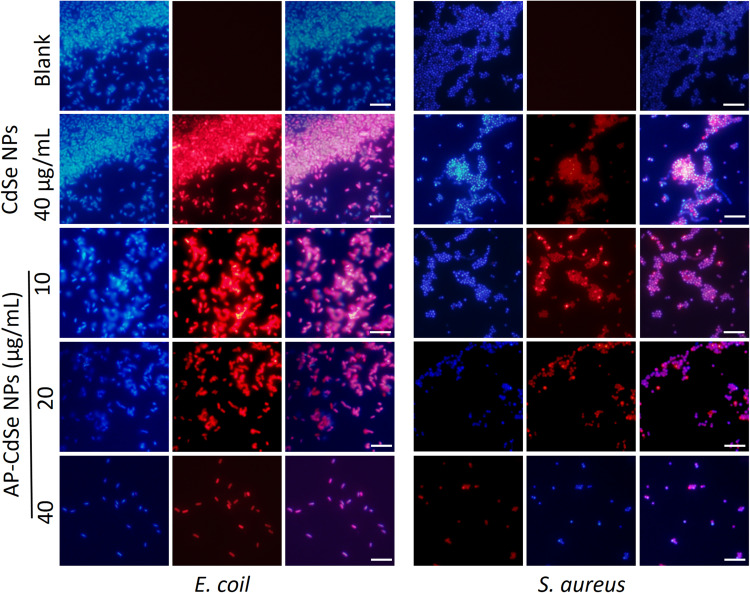
Figure 3.
Fluorescence microscopy images of MDR E. coli and MDR S. aureus bacterial culture treated with AP-CdSe NPs at various concentrations (10, 20, 40 µg/mL) for 12 h. The PBS was used for the blank group. The CdSe NPs (40 µg/mL) was set as the control group. Cells were stained with DAPI for 30 min are fluorescent blue, and those stained with AP-CdSe NPs are fluorescent red, while those with fluorescent pink color appearance represent merged images of cells. Fluorescence images were captured using an UV illuminator with a 365 nm emission filter for AP-CdSe NPs and a 461 nm emission filters for DAPI. Scale bar = 10 μm.

