Figure 5.
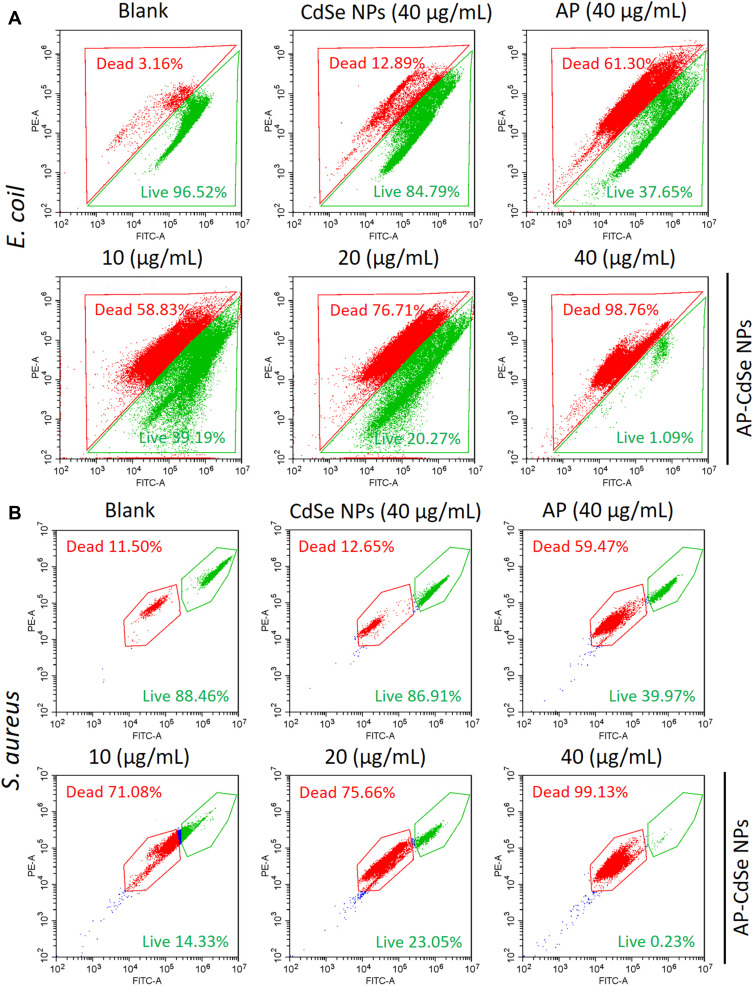
The results of the apoptotic cell death assay by flow cytometry analysis were statistically analyzed by the CytExpert software. MDR E. coli (A)and MDR S. aureus (B), after incubation with AP-CdSe NPs at various concentrations (10, 20, 40 µg/mL). AP solution (40 µg/mL) and CdSe NPs solution (40 µg/mL) were used as control groups. The PBS-treated group was used as blank group. All cells were subsequently briefly (30 min) stained with SYTO 9 and PI. Data are expressed as the mean ± SD (n=3).

