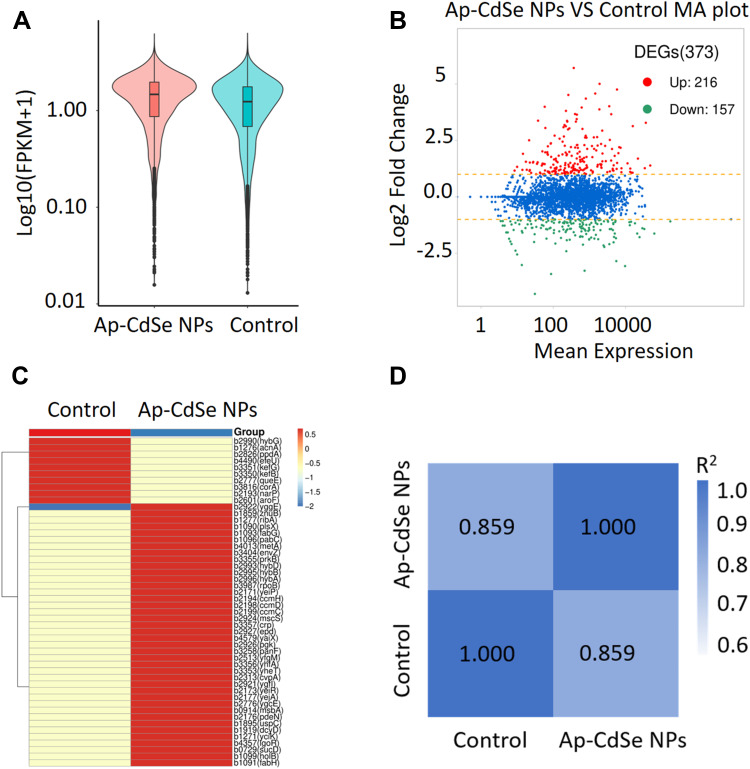
Figure 8.
Differentially expressed genes (DEGs) analyzed in MDR E. coli (AP-CdSe NPs and control). (A) FPKM density distribution of E. coli genes in control and AP-CdSe NPs groups. (B) Number of DEGs comparing the AP-CdSe NPs group with the control group. (C) Gene expression cluster analysis is used to determine the clustering pattern of gene expression in different treatment groups. (D) Pearson correlation coefficient between samples.

