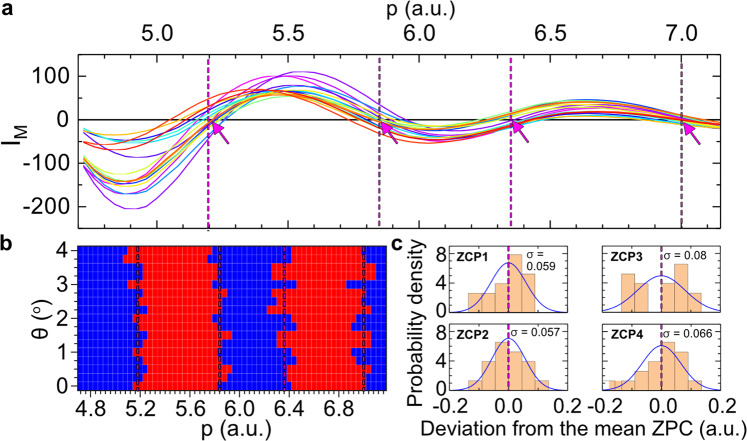
Fig. 2. Direct retrieval of molecular interference signal from the photoelectron momentum spectrum.
a Molecular interference signal, IM, in the laboratory frame as a function of scattering momentum, p, for 17 laboratory scattering angles, between 0.0 and 4.0° in steps of Δθ = 0.25°. Data between 4.72 and 7.16 a.u. are considered only for statistical reasons and for a valid comparison to the independent atom model (IAM). b Two-dimensional map of the negative (blue squares) and positive (red squares) parts of the molecular interference signal as a function of scattering angle and momentum. The magenta dashed vertical lines and arrows in panels (a) and (b) indicate the mean positions of the zero-crossing points (ZCPs) over all scattering angles, which are located at 5.18, 5.84, 6.36 and 7.00 a.u. c Frequency of occurrences of finite-width distributions of each averaged experimental ZCP obtained from panel (b). The variances calculated for the four ZCPs are 0.059, 0.057, 0.08 and 0.066 a.u., from the lowest to the highest momenta, respectively.

