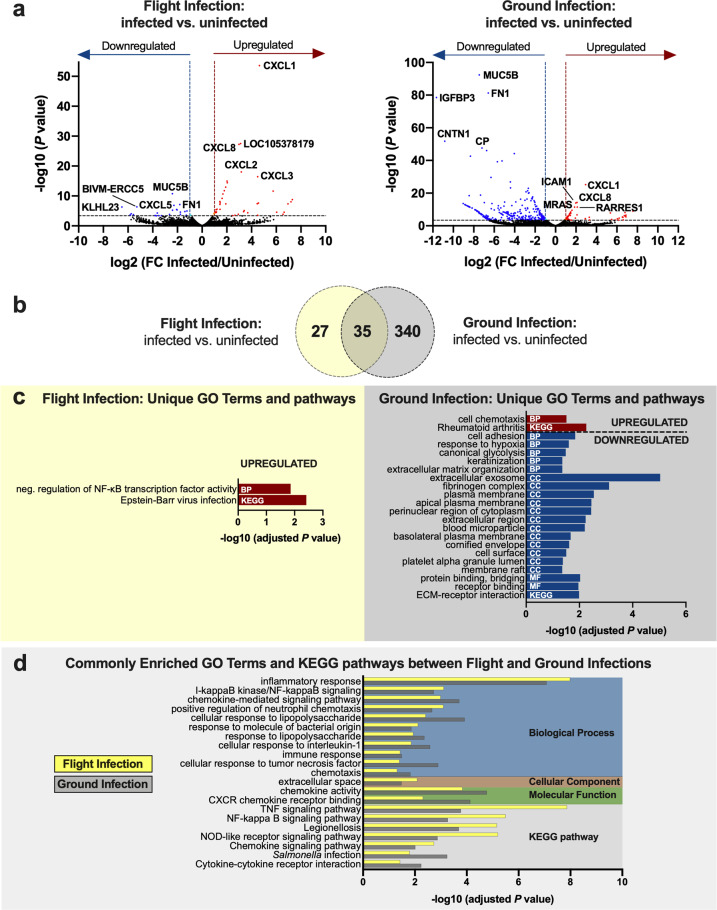
Fig. 2. Transcriptional responses of HT-29 cells elicited in response to infection with S. Typhimurium during flight or ground culture.
a Volcano plots. Differentially expressed genes between infected and uninfected host cells during spaceflight (left panel) or in matching ground controls (right panel). Red: significantly upregulated genes in response to infection. Blue: significantly downregulated genes. Significance determined according to a log2 fold change in expression of at least ±1 and FDR < 0.05. The top 5 significantly up and downregulated genes are labeled. b Venn diagram. Overlapping and distinct genes elicited in response to infection in flight and ground cultures. c, d Uniquely and commonly enriched GO terms and KEGG pathways in response to infection either in flight or ground cultures relative to their respective uninfected controls. Analysis was performed in DAVID 6.8 using upregulated (red) or downregulated (blue) transcripts using an EASE score of 0.05 and Benjamini–Hochberg correction to determine significantly enriched terms and pathways (adjusted P < 0.05). BP biological process, CC cellular component, MF molecular function. Bars in d indicate the results for a flight infection (yellow; flight infected/uninfected) and ground infection (gray; ground infected/uninfected).

