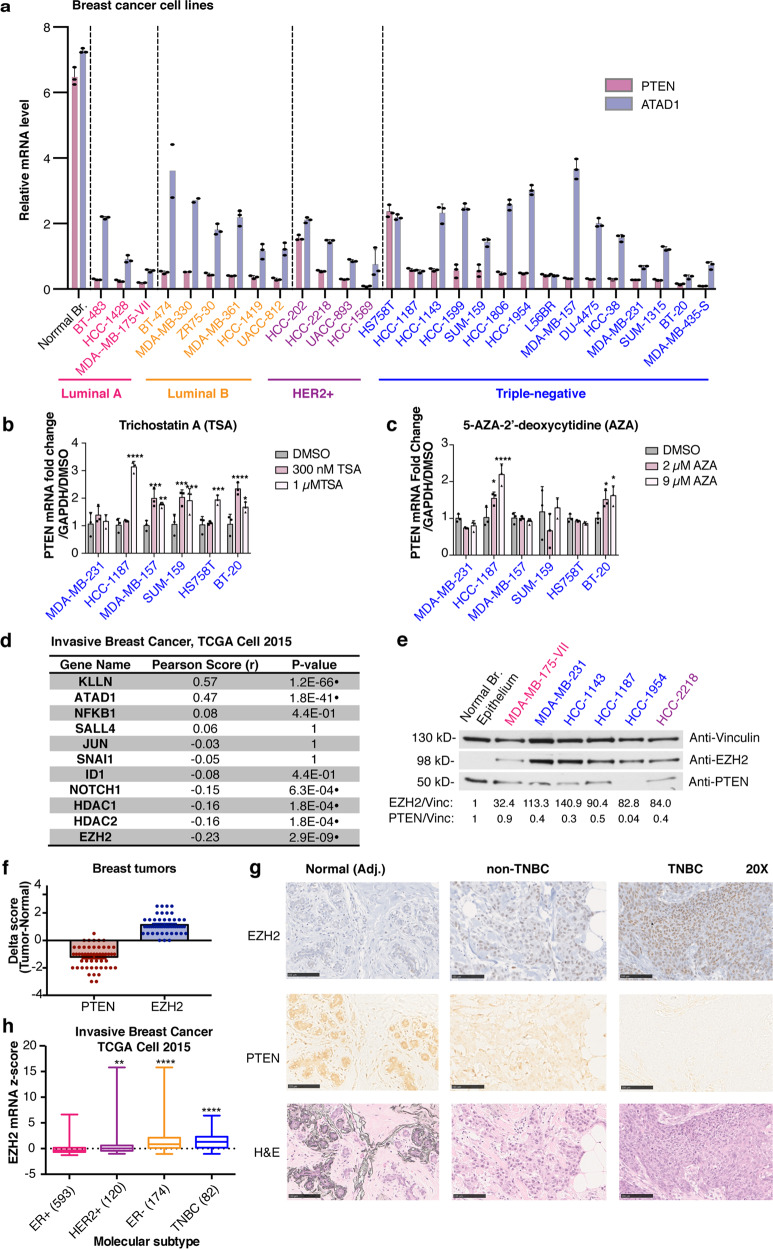
Fig. 1. Repression of the PTEN locus occurs in breast cancer, and associates with increased expression of EZH2 and other known transcriptional regulators.
a PTEN (red) and ATAD1 (blue) transcript levels were measured using qRT-PCR in breast cancer cell lines compared to normal mammary epithelial cells. Error bars are mean ± s.d., triplicate measurements. Significance from normal mammary epithelial cells derived from normal mammoplasty specimen: two-way ANOVA, Dunnett’s correction (P < 0.0001 for all). b Trichostatin A (TSA) and (c) 5-aza-2′-deoxycytidine (AZA) treatment was performed at the indicated doses and transcript levels of PTEN were measured by qRT-PCR in breast cancer cell lines. Error bars: mean ± s.d., triplicate measurements. Significance from Ctrl: one-way ANOVA, Sidak’s correction. d Analysis of co-expression with PTEN including Pearson correlation coefficients and P values in normalized RNA-seq data for previously reported PTEN-repressing genes and genes in the PTEN genomic locus (ATAD1 and KLLN). Cohort includes 818 breast cancer cases34. Significance: two-tailed t test, Pearson correlation (n = 818), black dot indicates a statistically significant result. P values adjusted for multiple comparisons by the Benjamini and Yekutieli method, α = 0.00162. e Protein levels of EZH2 and PTEN were measured by immunoblotting in the panel of indicated cell lines. Vinculin was loading control. Quantification is shown below each blot (signal normalized to Vinculin, calculated as a fold change compared to normal breast epithelium isolated from normal mammoplasty specimen). f Immunohistochemical analysis of breast tumors showing PTEN and EZH2 score. Score is expressed as a delta between tumor and normal ducts on the same slide (n = 51 cases). Clinical scoring is used (0–3+ range based on intensity). Error bars: mean ± s.e.m. g Reperentative photos of IHC staining in normal ducts (BRP ID# 6621), non-TNBC (BRP ID# 6617), and TNBC (BRP ID# 6706), showing PTEN, EZH2 and H&E. ×5 magnification, Scale bar: 500 µm. h Boxplots of EZH2 RNA-seq z-scores in the indicated subtypes of breast cancer34, number of cases indicated for each subtype (total n = 969). Significance from ER+: one-way ANOVA, Dunnett’s correction. (****P < 0.0001; ***P < 0.001; **P < 0.01; *P < 0.05).

