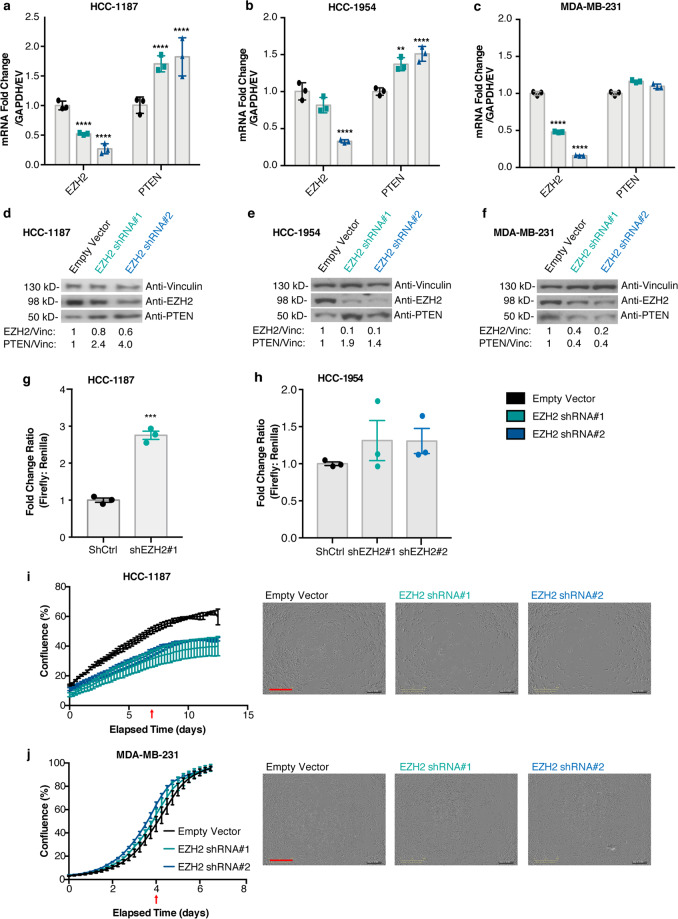
Fig. 3. Depletion of EZH2 restores PTEN expression and reduces proliferation in a subset of cell lines.
Stable shRNA knockdown of EZH2 was performed. EZH2 and PTEN transcript levels were measured by qRT-PCR (a–c) and protein levels were measured by immunoblotting in (d–f) HCC-1187 cells, HCC-1954 cells, and MDA-MB-231 cells, respectively. Vinculin was loading control. Quantification is shown below each blot (signal normalized to Vinculin, calculated as a fold change compared to Empty Vector). Error bars: mean ± s.d. (triplicate measurements). Significance from Ctrl: two-way ANOVA, Tukey’s correction. Luciferase activity at the PTEN promoter was measured (Pgl-1 from Fig. 2a) following stable knockdown of EZH2 in (g) HCC-1187 and (h) HCC-1954 cells. Error bars: mean ± s.e.m., n = 3 experiments. Proliferation was measured following EZH2 knockdown, the percentage of confluence over time (days) is displayed in (i) HCC-1187 cells and (j) MDA-MB-231 cells. Readings taken every 6 h. Error bars: mean ± s.d., triplicate measurements. Corresponding representative photos from indicated timepoints (red arrow) shown, Scale bar (red): 800 µm. Significance from Ctrl: two-way ANOVA, Tukey’s correction. (****P < 0.0001; ***P < 0.001; **P < 0.01).

