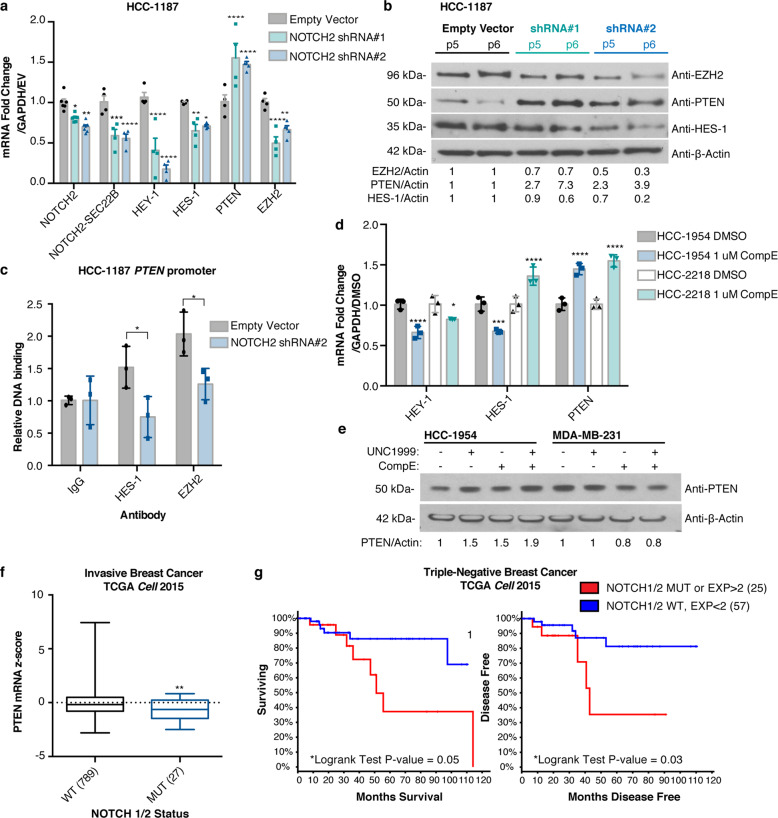
Fig. 5. Mutant NOTCH1/2 collaborates with EZH2 to drive transcriptional repression of PTEN and associates with poor prognosis.
a Transcript levels measured by qRT-PCR and (b) protein levels measured by immunoblotting of indicated genes following stable knockdown of NOTCH2. P5, P6 indicate passage number after infection. β-actin was the loading control and quantification is shown. Error bars: mean ± s.e.m., n = 4 experiments. Significance from Ctrl: two-way ANOVA, Dunnett’s correction. c ChIP-qPCR binding of indicated proteins to the PTEN promoter (Site B23, between Sites 3 and 4, Fig. 2a) following stable knockdown of NOTCH2. Relative DNA Binding is % input (normalized to IgG). Significance from Ctrl: two-way ANOVA, Sidak’s correction. Error bars: mean ± s.d., triplicate measurements. d HCC-1954 and HCC-2218 cells were treated for 6 days with 1 μM Compound E and expression of indicated genes were measured using qRT-PCR. Error bars: mean ± s.d., triplicate measurements. Significance from Ctrl: 2-way ANOVA, Tukey’s correction. e HCC-1954 and MDA-MB-231 cells were treated for 6 days with 1 μM Compound E and/or UNC1999 and expression of indicated genes were measured using immunoblotting. β-actin was the loading control and quantification is shown. f Boxplots of PTEN RNA-seq data from invasive breast cancer cases34 in NOTCH1/2 wild-type (WT) or mutant (MUT) groups. Number of cases indicated for each group (total n = 816). Significance: Mann–Whitney test. g Reduced overall survival and disease-free survival in TNBC cases34 harboring NOTCH1 or NOTCH2 mutations or overexpression (RNA-seq z-score > 2). Number of cases indicated for each group (total n = 82). Significance: Logrank test. (****P < 0.0001; ***P < 0.001; **P < 0.01; *P < 0.05).

