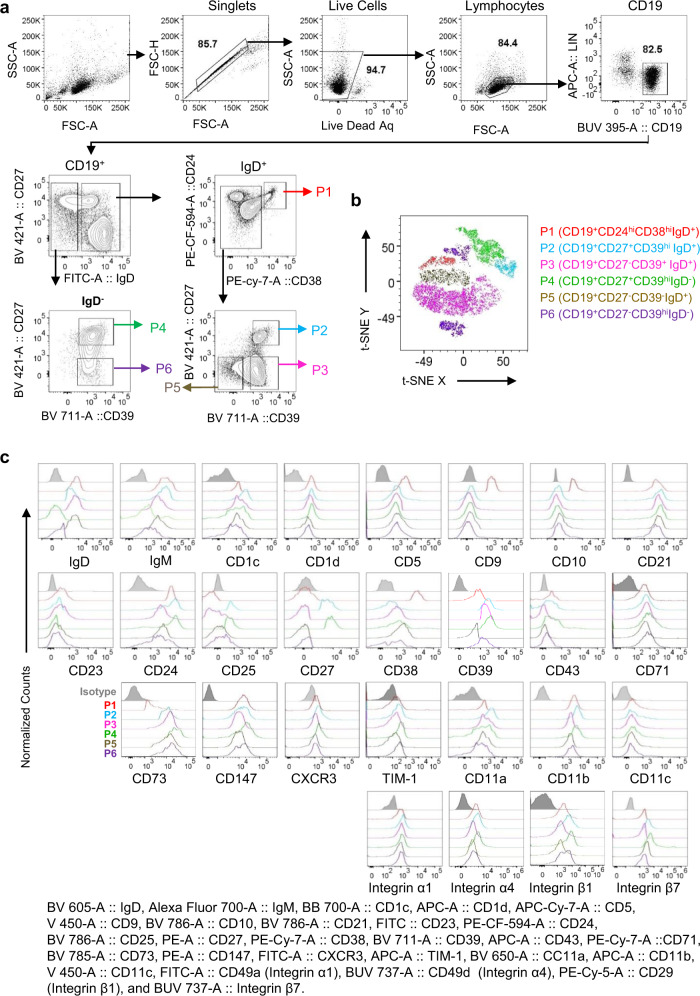
Fig. 2. Human peripheral blood B cells are composed of six different populations.
a B cells subsets P1 (CD19+CD24hiCD38hiIgD+), P2 (CD19+CD27+CD39hiIgD+), P3 (CD19+CD27−CD39+IgD+), P4 (CD19+CD27+CD39hiIgD−), P5 (CD19+CD27−CD39−IgD+), and P6 (CD19+CD27−CD39+IgD−) B cells in the blood of healthy subjects. Data generated with cells from healthy subjects (n = 5) were combined. b A t-SNE plot, showing the distribution of the six B cell populations (P1 to P6). t-SNE plots were made on CD19+ B cells using cell surface markers, including IgD, CD24, CD27, CD38, CD39, with iteration 1000, perplexity 30, and learning rate (eta) 1564. c Cell surface expression of IgD, IgM, CD1c, CD1d, CD5, CD9, CD10, CD21, CD23, CD24, CD25, CD27, CD38, CD39, CD43, CCD71, CD73, CD147, CXCR3, TIM-1, CD11a, CD11b, CD11c, integrin α1, integrin α4, integrin β1, and integrin β7 on P1 (red), P2 (light blue), P3 (pink), P4 (light green), P5 (army green), and P6 (violet) B cells. Data generated with cells from healthy subjects (n = 5) were combined.

