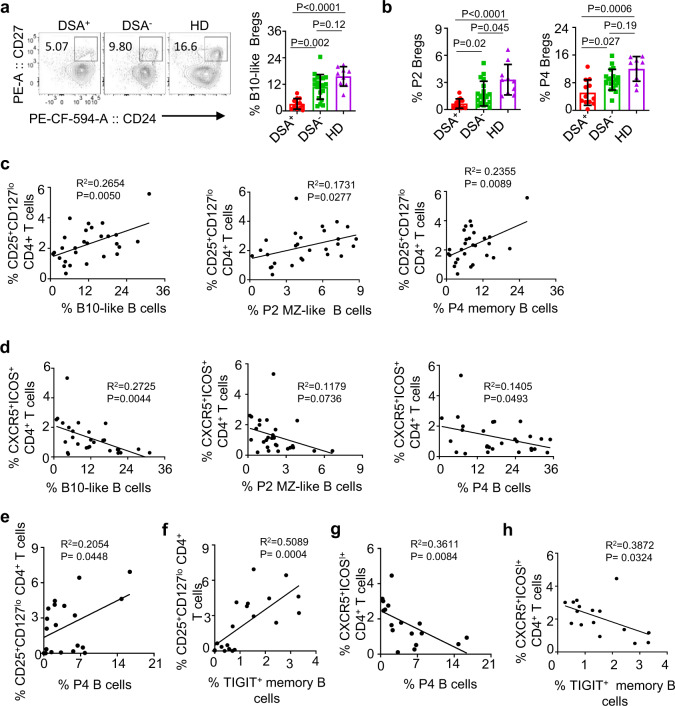
Fig. 8. TIGIT+ memory B cells in liver and kidney allograft recipients.
a, b Representative FACS plots and summarized data for the frequency of CD19+CD24hiCD27+ B10-like Bregs (a), and P2 MZ-like and P4 memory B cells (b) in the blood of donor-specific antibody (DSA)+ (n = 12) and DSA− (n = 19) liver transplant patients and healthy controls (n = 9). Dots represent individual patients. c, d Scatter plots showing the association of the frequency of B10-like, P2 MZ-like, and P4 memory B cells with CD4+CD25+CD127lo Tregs (c) and with CXCR5+ICOS+ TFH cells (d) in liver allograft recipients. e, f Scatter plots showing the association of the frequency of P4 memory (e) and TIGIT+ memory B cells (f) with that of CD4+CD25+CD127lo Tregs in renal allograft recipients. g, h Scatter plots showing the association of the frequency of P4 memory B cells (g) and TIGIT+ memory B cells (h) with that of CD4+CXCR5+ICOS+ TFH in renal allograft recipients. Error bars indicate mean ± SD. P values were determined with one-way ANOVA with Dunnett’s multiple comparison test (a, b). R2 and P values were calculated using Pearson correlation tests (c–h).

