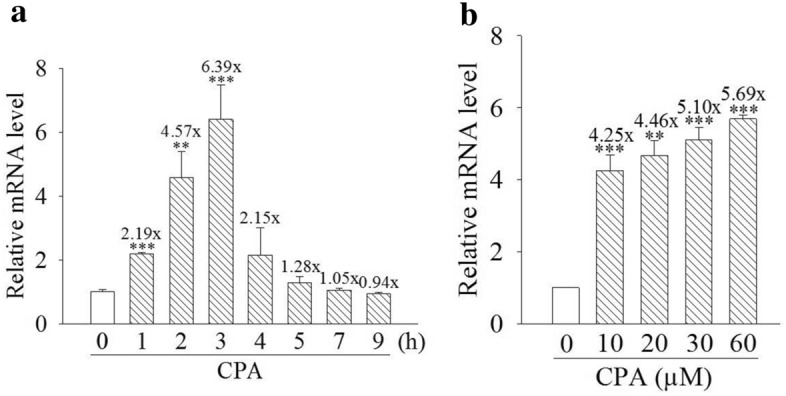
Figure 2.

Expression profiles of cytochrome P450 1A1 (CYP1A1) mRNA induced by cyproterone acetate (CPA) in mouse cells. (a) Hepa-1c1c7 cells were treated with CPA (30 μM) for 1–9 h. (b) Hepa-1c1c7 cells were treated with CPA (10, 20, 30, and 60 μM) for 3 h. Total RNA was harvested for the analysis. The expression of CYP1A1 mRNA was analyzed by quantitative PCR, as described in “Materials and methods”. Results are expressed as the mean ± SD, n = 3. **p < 0.01, and ***p < 0.001.
