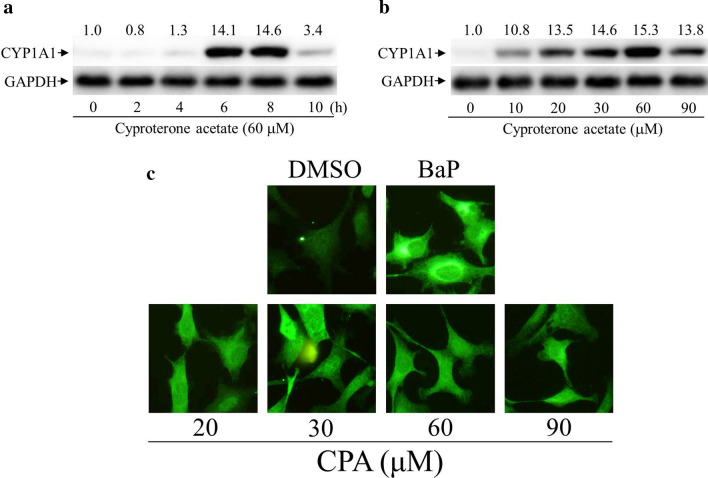
Figure 3.
Expression profiles of cytochrome P450 1A1 (CYP1A1) protein induced by cyproterone acetate (CPA) in mouse cells. (a) Hepa-1c1c7 cells were treated with CPA (60 μM) for 2–10 h. (b) Hepa-1c1c7 cells were treated with CPA (10–90 μM) for 6 h. Expression of the CYP1A1 protein was analyzed by Western blots. The CYP1A1 protein levels revealed by Western blotting were quantified and standardized against the amounts of β-actin or GAPDH protein. The relative levels of CYP1A1 expression are indicated on the top of the bands. (c) CPA and benzo[a]pyrene (BaP)-induced CYP1A1 expression as revealed by immunofluorescence images. Hepa-1c1c7 cells were treated with CPA (20–90 μM) and BaP (10 μM) for 6 h. Afterward, cells were fixed with ethanol. Expression of the CYP1A1 protein was probed using an antibody against CYP1A1, as revealed by fluorescence of a rabbit polyclonal secondary antibody to rabbit IgG-H&L (DyLight 488). Fluorescence emitted by cells was viewed using a fluorescence microscope, equipped with optical filters at excitation/emission wavelengths of 493/518 nm.

