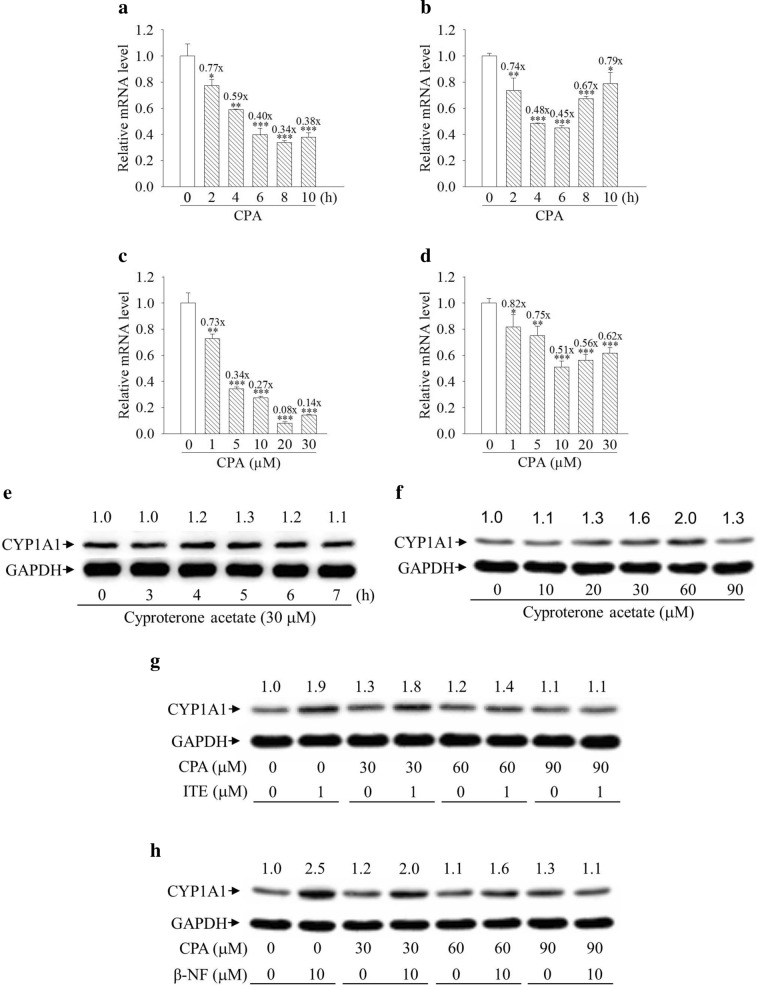
Figure 7.
Expression profiles of cytochrome P450 1A1 (CYP1A1) mRNA and protein induced by cyproterone acetate (CPA) in human cells. (a,b) HepG2 and MCF7 cells were treated with CPA (10 μM) for 2–10 h. (c,d) HepG2 and MCF7 cells were treated with CPA (1–30 μM) for 6 h. Total RNA was harvested for the analysis. The expression of CYP1A1 mRNA was analyzed by quantitative PCR, as described in “Materials and methods”. Results are expressed as the mean ± SD, n = 3. *p < 0.05, **p < 0.01, and ***p < 0.001. (e) HepG2 cells were treated with CPA (30 μM) for 3–7 h. (f) HepG2 cells were treated with CPA (10–90 μM) for 5 h. (g,h) HepG2 cells were pretreated with 30–90 μM CPA for 1 h, followed by treatment with 1 μM ITE for 5 h and 10 μM β-NF for 6 h. Expression of the CYP1A1 protein was analyzed by Western blots. The CYP1A1 protein levels revealed by Western blotting were quantified and standardized against the amount of GAPDH protein. The relative levels of CYP1A1 are indicated on the top of the bands.

