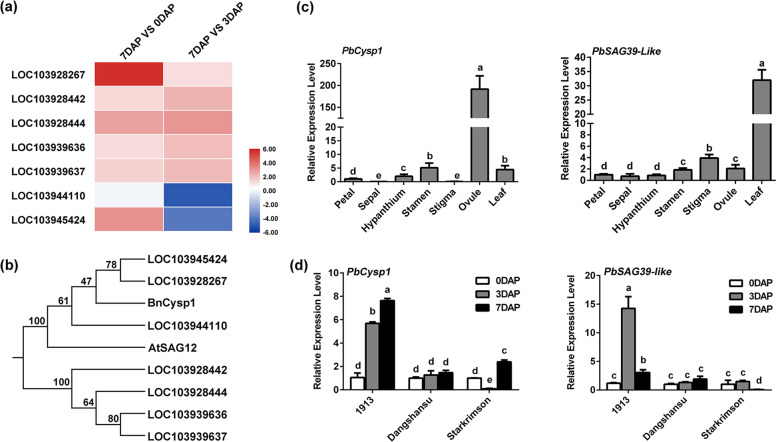
Fig. 4. Expression patterns of PbCysp1 and PbSAG39-like.
a Heatmap showing the differential expression of all PbCysp genes in the ‘1913’ transcriptome. b Phylogenetic tree of amino acid sequences of Cysp proteins in pear and senescence-related Cysp proteins in Arabidopsis thaliana and Brassica napus. c Tissue-specific expression of PbCysp1 and PbSAG39-like. d PbCysp1 and PbSAG39-like expression patterns at different stages in ‘1913’, ‘Dangshansu’, and ‘Starkrimson’. The expression levels of each gene in ‘Starkrimson’ at 0 DAP and those of PbCysp1 and PbSAG39-like in petals were normalized to 1.0. The data are mean ± SDs of three biological replicates. Different letters between bars indicate significant differences at P < 0.05 (Duncan’s multiple range test)

