Figure 3.
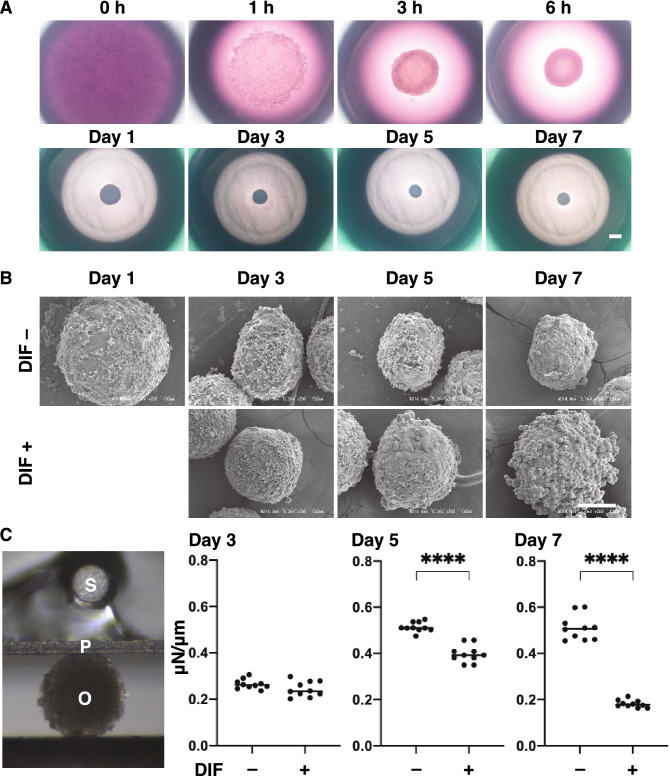
Characterization of the maturation process of the 3T3-L1 3D organoid with (DIF+) or without adipogenesis (DIF−). Representative phase contrast microscopy (PC) images at several time points (0, 1, 3, or 6 h, or Day1, 3, 5 or 7) of 3T3-L1 3D organoids without adipogenesis (DIF−) are shown in (A) (Scale bar: 100 µm). Electron microscope (EM) images at several time points (Day1, 3, 5 or 7) of the 3T3-L1 organoids without (DIF−) or with adipogenesis (DIF+) (B, Scale bar: 100 µm). Since adipogenic differentiation was induced from Day 1, the EM image of DIF+ at Day 1 is omitted. A single 3D organoid was compressed by a micro-squeezer, and the compression process was continuously monitored by a microscopic camera (C left, S: sensor, P: plate, O: organoid). As the physical stiffness at several time points (Day 3, 5 or 7) of 3D organoids without (DIF−) or with adipogenesis (DIF+), the force (μN) required to induce deformation until their half diameter (μm) was reached were measured, and force/displacement (μN/μm) was potted (C right). ****P < 0.001, and other pairs were not statistically significant (ANOVA followed by a Tukey’s multiple comparison test).

