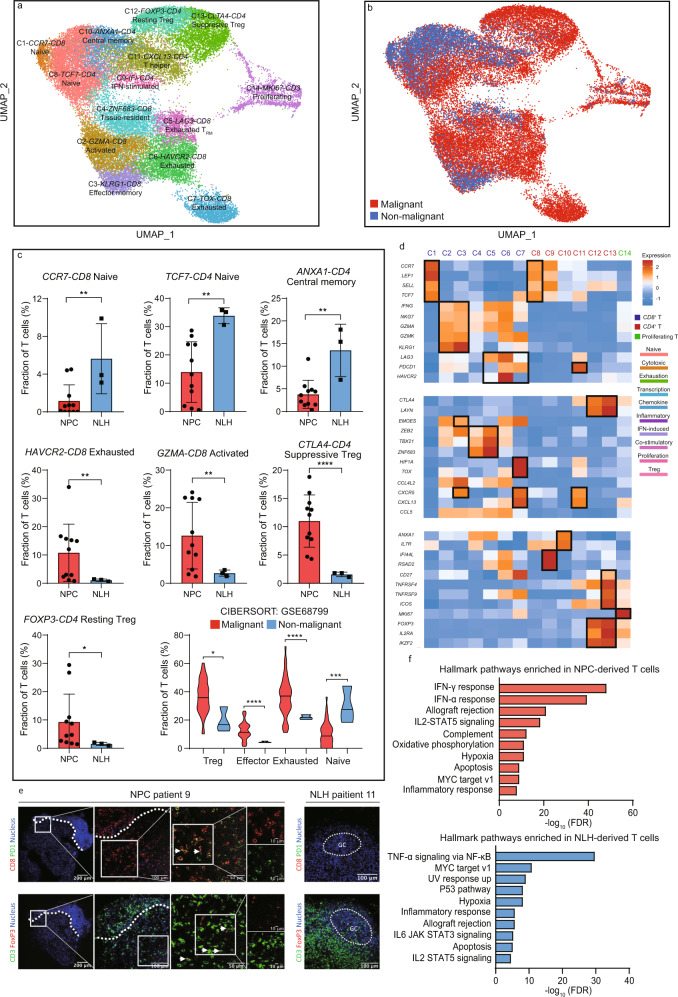
Fig. 2. Enrichment of exhausted and immunosuppressive T cell phenotype is a tumor-specific characteristic in the NPC microenvironment.
a UMAP plot of 32,656 T cells from 14 patients, identifying 14 subpopulations. Each dot represents one single cell, color-coded by the cluster. b UMAP plot of 32,656 T cells from the NPC microenvironment and NLH microenvironment. Each dot represents one single cell, color-coded by the sample type. c The relative abundance of significantly enriched T cell subpopulations in the malignant (For single-cell data, n = 11 biologically independent samples; for CIBERSORTx estimation, n = 42 biologically independent samples) and non-malignant (For single-cell data, n = 3 biologically independent samples; for CIBERSORTx estimation, n = 3 biologically independent samples) microenvironment. Each dot represents one patient. The two-sided Student’s t test was used to determine the statistical significance. p values ≤ 0.05 were represented as *, ≤0.01 as **, ≤0.001 as ***, ≤0.0001 as ****. Data are presented as mean values ± SD. Source data are provided as a Source Data file. d The normalized average expression of functional signatures for T cells subpopulations defined in a. e Infiltration of exhausted CD8+ T cells and Treg in the NPC and NLH microenvironment. Representative images of PD1+ CD8+ T cells and FOXP3+ Treg cells in the NPC patient 9 (white arrows). The left photo shows a low magnification overview (×100); the right photo shows the boxed area in the left photo. Representative images of expression of PD1 (FITC) on CD8+ T cells (TRITC, white arrow) and FOXP3 (TRITC) on CD3+ T cells (FITC) in NLH patient 11 (original magnification, ×200). GC, germinal center. Three independent experiments were performed and generated similar results. f The GSEA hallmark pathways enriched in the NPC-derived and NLH-derived T cells, ordered by -log10 false discovery rate (FDR).

