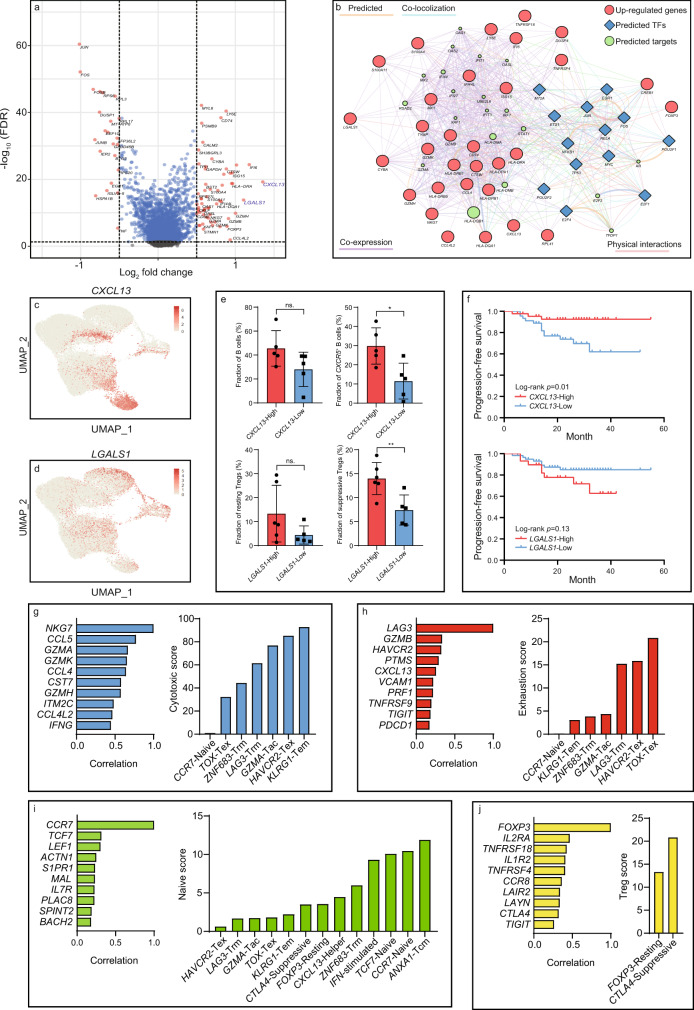
Fig. 3. Identification of NPC-specific T cell signatures and characterization of their correlations to patient prognosis and T cell dynamics.
a The differentially expressed genes (log2 fold change ≥0.5, FDR ≤ 5 × 10⁻²) in NPC-derived and NLH-derived T cells identified by the MAST analysis. b The gene regulatory network constructed by Cytoscape, colored for the associated gene type (red: top 30 upregulated genes from NPC-derived T cells, blue: the upstream transcription factors predicted by RegNetwork, green: the targeted genes predicted by GeneMANIA). c The expression of CXCL13 in each T cell profiled on the UMAP. d The expression of LGALS1 in each T cell profiled on the UMAP. e The total B cell fraction and CXCR5+ B cell fraction in CXCL13-high (n = 5 biologically independent samples) and CXCL13-low groups (n = 5 biologically independent samples); The resting Treg fraction and suppressive Treg faction in LGALS1-high (n = 6 biologically independent samples) and LGALS1-low groups (n = 5 biologically independent samples). Each dot represents one patient. The two-sided Student’s t-test was used to determine the statistical significance, p-values >0.05 were represented as ns. (not significant), p values ≤ 0.05 were represented as *, ≤0.01 as **. Data are presented as mean values ± SD. f The progression-free survival for 88 NPC patients, stratified for the normalized average expression (binary: high expression vs. low expression) of CXCL13 and LGALS1. p values were determined based on the two-sided log-rank test. g The most correlated genes to NKG7 (the representative gene in the cytotoxic module) across cytotoxic T cells and predicted cytotoxic scores for CD8+ subpopulations based on the linear model constructed by this set of genes. h Similar to g but showing the most correlated genes to LAG3 (the representative gene in the exhaustion module) across exhausted T cells and predicted exhaustion scores for CD8+ subpopulations. i The most correlated genes to CCR7 (the representative gene in the naive module) across naïve T cells and predicted naive scores for all T cell subpopulations. j The most correlated genes to FOXP3 (the representative gene in the Treg module) across Tregs and predicted Treg scores for Treg subpopulations. Source data are provided as a Source Data file.

