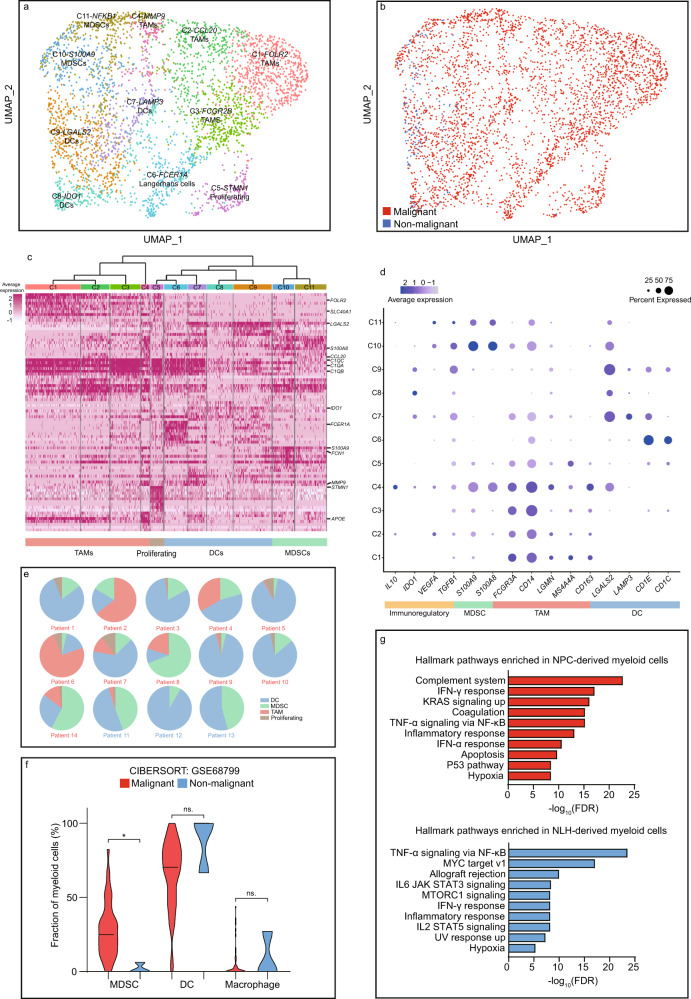
Fig. 7. The NPC microenvironment harbors suppressive myeloid subtypes with high patient-specific heterogeneity.
a UMAP plot of 3,671 myeloid cells, color-coded by the associated cluster. b UMAP plot of 3,671 myeloid cells, color-coded by the sample type. c The expression matrix containing the top 50 enriched genes in each subpopulation defined in a, with a clustering tree categorizing related subpopulations into major subtypes. d The expression of functional signatures that were used to identified and characterized the subpopulations. e The inter-patient distribution of major myeloid subpopulations, shown by the percentage of total myeloid cells. f The estimated abundance of major myeloid subpopulations via CIBERSORTx (malignant n = 42 biologically independent samples, non-malignant n = 3 biologically independent samples). The two-sided Student’s t test was used to determine the statistical significance, p values > 0.05 were represented as ns. (not significant), p values ≤ 0.05 were represented as *. g The GSEA hallmark pathways enriched in NPC-derived and NLH-derived myeloid cells, ordered by −log10 FDR. Source data are provided as a Source Data file.

