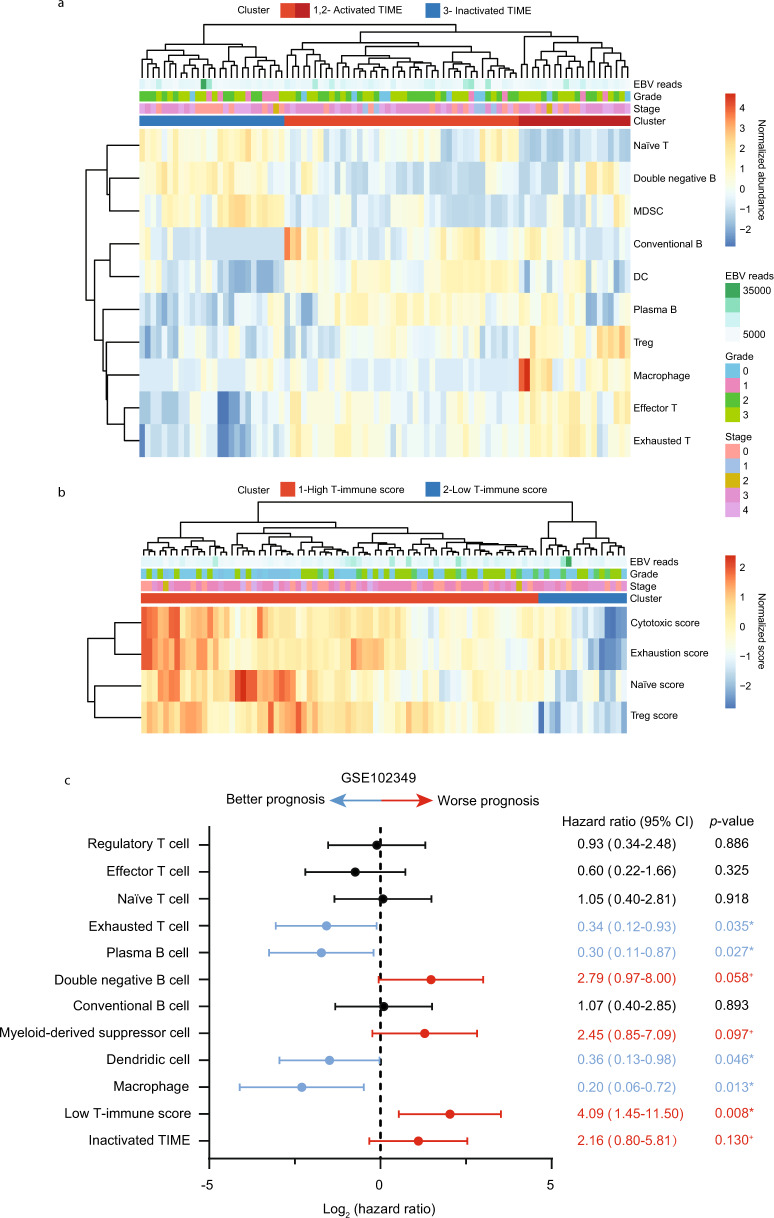
Fig. 8. Deconvolution analysis and functional modules reveal dynamic immune signatures that are associated with patient prognosis.
a Heatmap of the normalized immune abundance and clinical parameters in 88 NPC patients estimated by CIBERSORTx. Patients were clustered into three groups, representing those with activated TIME (cluster 1 and 2) or inactivated TIME (cluster 3). b Heatmap of the normalized functional scores and clinical parameters in 88 NPC patients calculated by our linear model. Patients were clustered into two groups, representing those with high T-immune score (cluster) or low T-immune score (cluster 2). c The correlation between estimated subpopulations, patient clusters and progression-free survival in 88 NPC patients. The log2 hazard ratio and the associated p-value was evaluated by the Cox proportional hazards model with 95% CI. p values ≤ 0.05 were considered statistically significant in prognosis, whereas p value > 0.05 and ≤ 0.15 were considered marginally significant in prognosis and represented as +. Source data are provided as a Source Data file.

