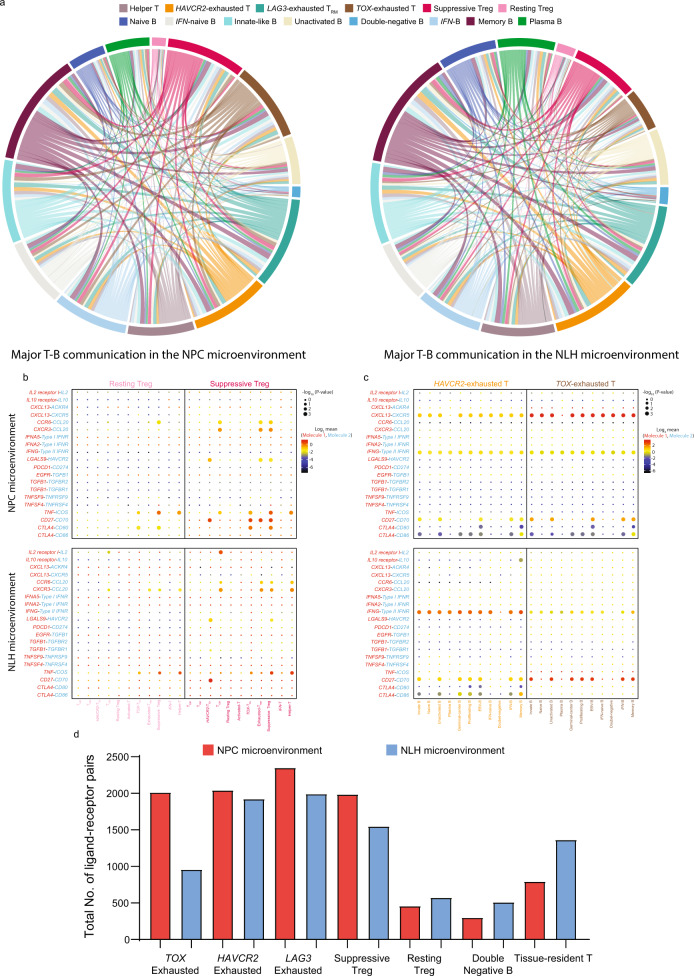
Fig. 9. Single-cell referenced communication analysis exhibits tumor-specific ligand–receptor interactions within T and B cell subpopulations.
a The cell-cell communications within major T and B cell subpopulations in the NPC microenvironment and NLH microenvironment, shown by chord diagram, colored by cell subtypes. The size of the arc represented the total number of ligand–receptor pairs, and the size of the flow represented the number of ligand-receptor pairs between two cell subtypes. b Overview of selected ligand-receptor interactions between resting Treg/suppressive Treg and functional T cell subpopulations, c between HAVCR2 exhausted T cells/TOX exhausted T cells and all B cell subpopulations. p values were calculated using the two-sided Student’s t test with 95% CI and refer to the enrichment of the interacting ligand-receptor pair in each of the interacting pairs of cell types. Log2 mean referred to the strength of a specific ligand-receptor connection in the corresponding cell types. d The total number of ligand-receptor pairs in the NPC-derived and NLH-derived T and B subpopulations. Source data are provided as a Source Data file.

