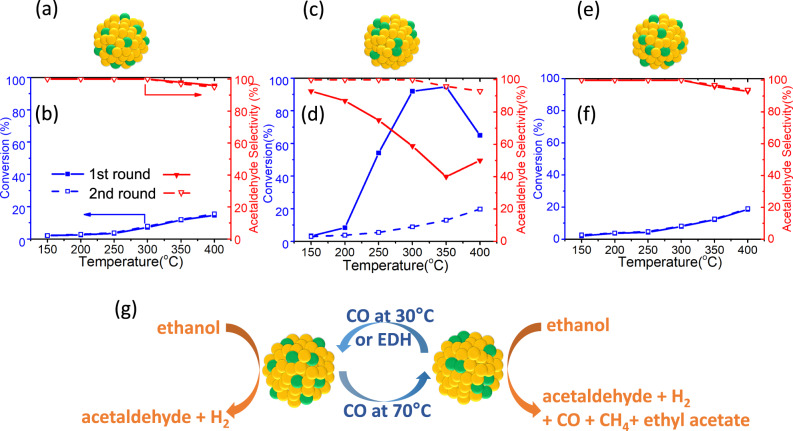
Fig. 4. In situ control over a reaction pathway via CO treatment.
Structure (a, c, e) and catalytic performance (b, d, f) of a Pd0.02Au0.98/SiO2 sample after (a, b) no CO treatment, (c, d) CO at 30 °C for 30 min then 70 °C for 30 min which causes Pd to form clusters, (e, f) CO treatment at 30 °C for 30 min, then 70 °C for 30 min, then 30 °C for 1 h which causes Pd to aggregate and then re-disperse back into atoms. g Schematic illustration showing how CO treatment can be used to change Pd from atoms to clusters and back, and the effect of these different active sites on reaction pathway. Ethanol dehydrogenation (EDH) reaction conditions: 300 mg catalyst, 2% ethanol in helium, total flow rate 12 mL/min, GHSV = 2400 mL/(h∙gcat). Each temperature was held for 2 h. The solid line shows the first-round EDH reaction from 150 °C to 400 °C; the dotted line is the second round reaction. Each point is the average of data obtained during 2 h.

