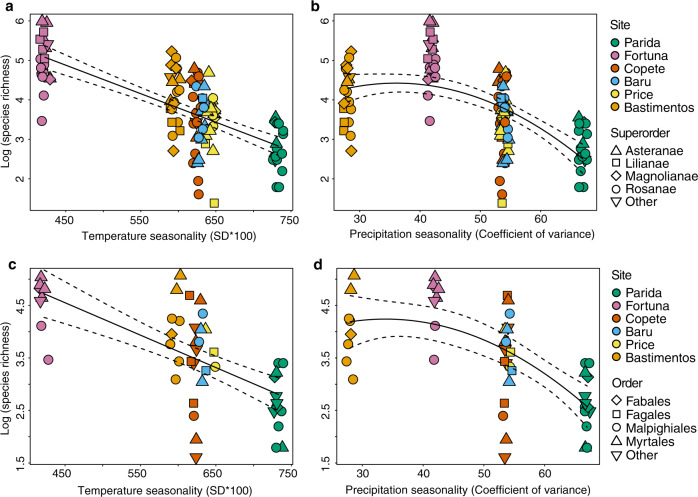
Fig. 3. Species richness of endophytes in tropical trees reflects both temperature seasonality and precipitation seasonality.
Richness decreased (a) linearly as temperature seasonality increased, and (b) as a quadratic function with respect to precipitation seasonality (R2 = 0.48 and 0.36, respectively; p < 0.0001 in each case, n = 106 biologically independent samples). Colors correspond to sites (Fig. 1) and shapes correspond to superorders (Supplementary Data 2). The same pattern was observed in endophyte richness in the Rosanae, the most frequently collected superorder of host plants (c, d: R2 = 0.43 and 0.42, respectively, and p < 0.05 in each case; shapes correspond to orders, Supplementary Data 2). Although additional factors may covary with seasonality (e.g., factors in Supplementary Table 3), they have little explanatory power after temperature and precipitation seasonality are considered (Fig. 4). Dotted lines represent 95% confidence interval.

