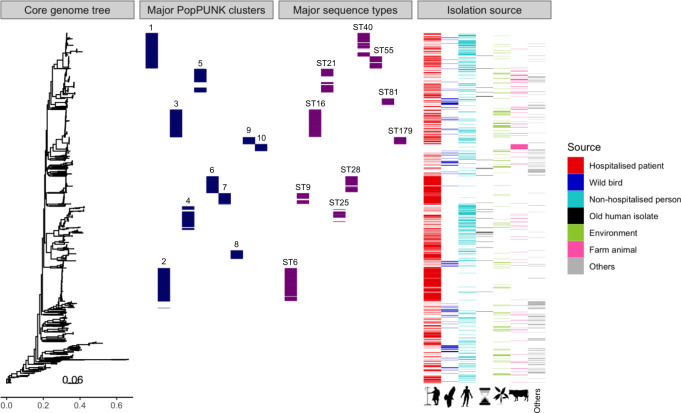
Fig. 1. Overview of the species-wide E. faecalis collection (n = 2027) depicts interlinkage of the population across host types.
First panel, maximum likelihood (ML) phylogeny on mapping-based68 core-genome alignment, estimated by RaxML v.8.2.876. Second and third panels, coloured blocks depicting the ten largest Population Partitioning Using Nucleotide K-mers (PopPUNK)19 clusters (blue) and multi-locus sequence types (MLSTs) (purple), respectively, against the species-wide phylogeny. Fourth panel, isolates coloured as per their isolation source: hospitalised patient (red), wild bird (dark blue), non-hospitalised person (light blue), old human isolates (black), environment (green), farm animal (pink) and others (grey). Source data are provided as a Source Data file.

