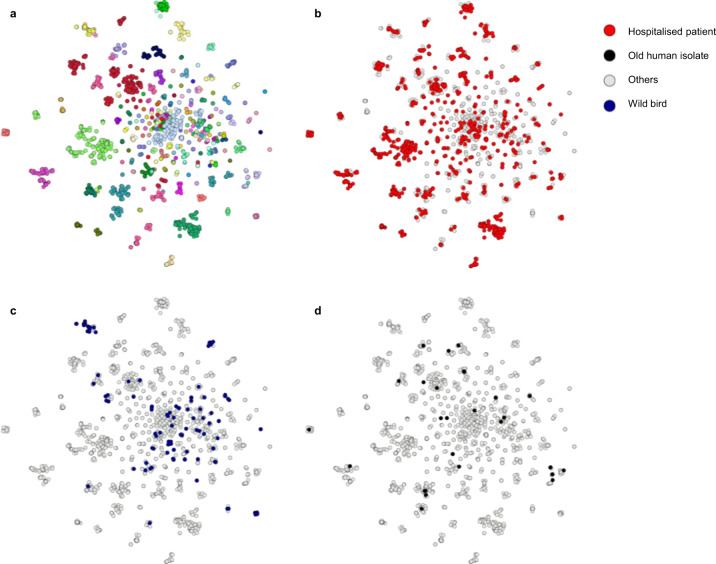
Fig. 2. Pangenome Neighbour Identification for Bacterial Populations (PANINI)28 networks on E. faecalis pangenome depict isolates of different origins distributed across the clade structure and embedded within the same, clearly defined extant clusters.
a PANINI network depicts accessory clusters predominantly following the designated Population Partitioning Using Nucleotide K-mers (PopPUNK; PP)19 clustering, with each node representing a single isolate (n = 2027), each group of attached nodes largely representing a PANINI cluster (n = 70), and each colour indicating a separate PP cluster (n = 173). b Hospitalised patient isolates shown in red and other isolation sources in grey. c Wild bird isolates shown in dark blue and other isolation sources in grey. d Old isolates of human origin shown in black and other isolation sources in grey. The illustration was created using Microreact77. Source data are provided as a Source Data file.

