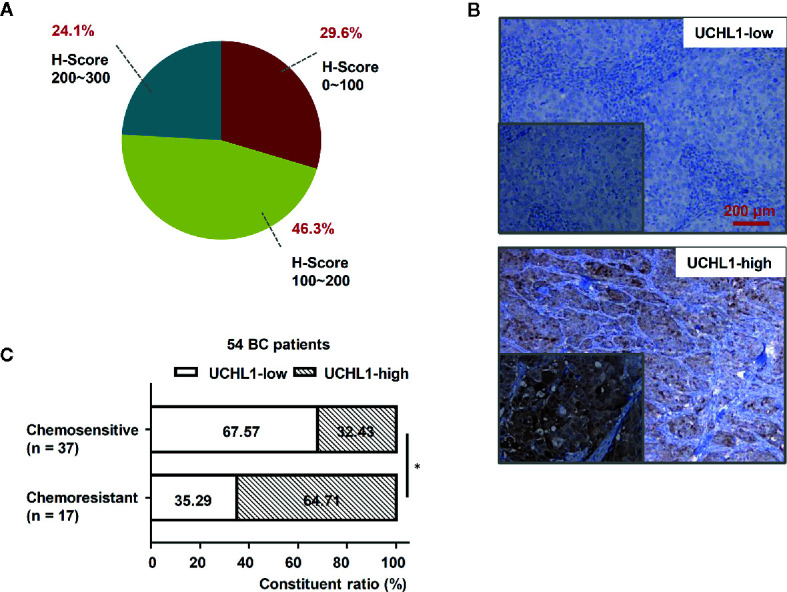
Figure 1.

High UCHL1 expression was associated with chemoresistance in patients with BC. (A) The scores (ranged from 0 to 300) of IHC staining of UCHL1 expression in 54 BC samples were calculated and its proportions are shown. (B) Representative images showing both UCHL1-high and UCHL1-low expression were presented (red bar: 200 μm). Comparison of chemoresistant status in 54 BC patients with different levels of UCHL1 expression (C). Statistical analysis was performed with χ2 test. *p < 0.05.
