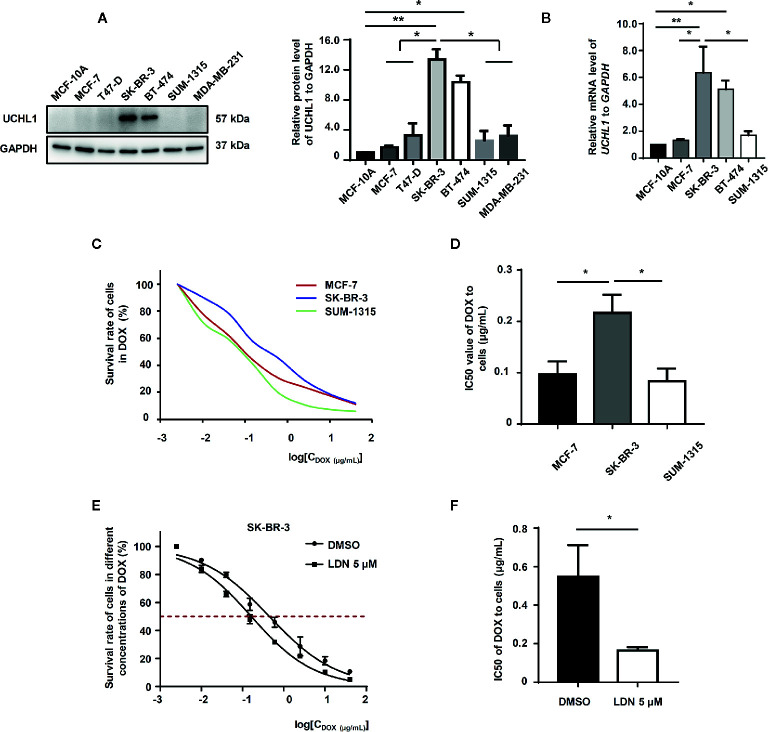
Figure 3.
UCHL1 level and its role in BC cells. Western blot (A) and real-time PCR (B) analysis of UCHL1 levels in BC cells are shown and were analyzed by Mann-Whitney test (n = 3). Cell viability curves of BC cells treated with DOX, as evaluated by CCK8 assay (C). The IC50 values, as analyzed by Mann–Whitney test (n = 3) (D). Cell viability curves and IC50 values of SK-BR-3 cells treated with DOX in the presence of 5 μM LDN or DMSO are shown (n = 3) (E, F). * p < 0.05, ** p < 0.01.

