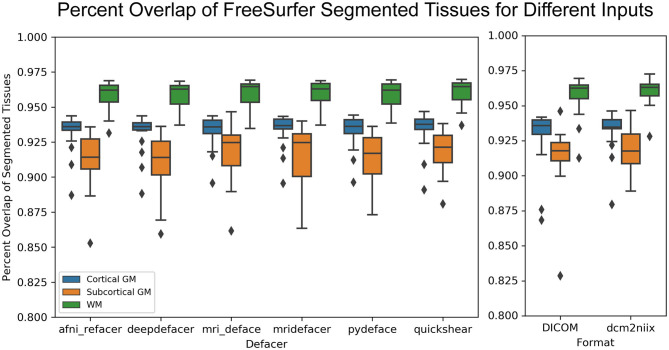
Figure 8.
Boxplot showing the percent overlap of FreeSurfer segmented tissues for the defaced scans (left) and different file formats (raw DICOM and NIfTI files converted using alternate method, right), as defined by the area of the intersection with the original input scan, divided by the area of the union with the original, for that tissue.

