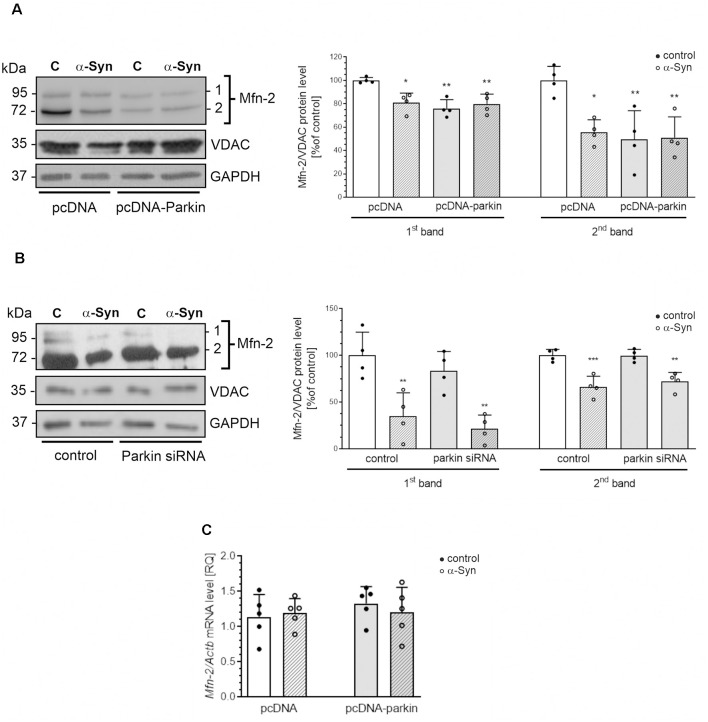
Figure 5.
The effect of α-Syn treatment or parkin modifications on the protein expression of mitofusin-2. (A) The immunoreactivity of Mfn-2 normalized to VDAC (GAPDH was presented as a loading control) in pcDNA and pcDNA-Parkin PC12 cells treated with α-Syn for 24 h at a concentration of 5 μM. Data were normalized to the untreated control group (=100%) and represent the mean value ± SD for four independent experiments (n = 4). *p < 0.05, **p < 0.01, compared to pcDNA control cells using two-way ANOVA followed by Bonferroni post hoc test. (B) The immunoreactivity of Mfn-2 normalized to VDAC (GAPDH was presented as a loading control) in Parkin knock-down PC12 cells treated with α-Syn for 24 h at a concentration of 5 μM. Data were normalized to the untreated control group (= 100%) and represent the mean value ± SD for four independent experiments (n = 4). **p < 0.01, ***p < 0.001 compared to control cells using two-way ANOVA followed by Bonferroni post hoc test. (C) The mRNA level of Mfn-2 in pcDNA and pcDNA-Parkin PC12 cells treated with α-Syn for 24 h at a concentration of 5 μM. The mRNA level was measured by real-time PCR and normalized to Actb (β-actin). Data represent the mean value ± SD for five independent experiments (n = 5).

