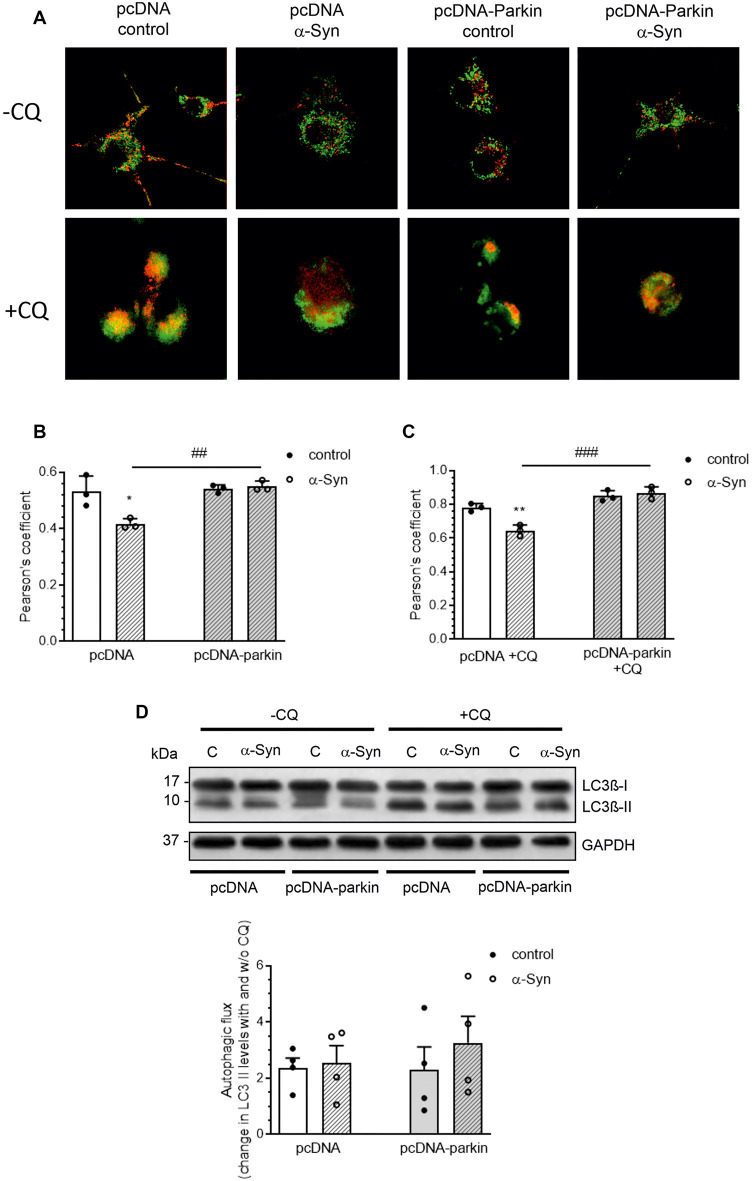
Figure 6.
Parkin deregulation is involved in the alteration of mitochondrial autophagy in PC12 cells treated with α-Syn. (A) Single confocal captions showing an overlay of Lysotracker Red (LTR; red) and Mitotracker Green (MTG; green) in pcDNA and pcDNA-Parkin PC12 treated for 24 h with α-Syn at a concentration of 5 μM in the absence (top panel)/presence (bottom panel) of 40 μM chloroquine (CQ). Scale bar: 10 μm. The presented cells are representative of most of the analyzed cells. (B) Pearson’s colocalization coefficient (PCC) of LTR and MTG in PC12 cells treated for 24 h with α-Syn. Data were derived from three independent experiments with eight fields per experiment (n = 3). Each value is expressed as PCC ± SD *p < 0.05 compared to pcDNA control cells; ##p < 0.01 compared to pcDNA cells treated with α-Syn, using two-way ANOVA followed by Bonferroni post hoc test. (C) Pearson’s colocalization coefficient (PCC) of LTR and MTG in PC12 cells treated for 24 h with α-Syn in the presence of 40 μM CQ. Data were derived from three independent experiments with eight fields per experiment (n = 3). Each value is expressed as PCC ± SD **p < 0.01 compared to pcDNA control cells; ###p < 0.001 compared to pcDNA cells treated with α-Syn, using two-way ANOVA followed by Bonferroni post hoc test. (D) Immunoblotting of LC3-I and LC3-II in pcDNA and pcDNA-Parkin PC12 cells treated for 24 h with α-Syn at a concentration of 5 μM in the absence (left panel)/ presence (right panel) of 40 μM CQ for the last 2 h. Densitometric quantitation shows autophagic flux represented by a change in chloroquine-induced LC3-II levels. Data represent the mean value ± SD for four independent experiments (n = 4).

