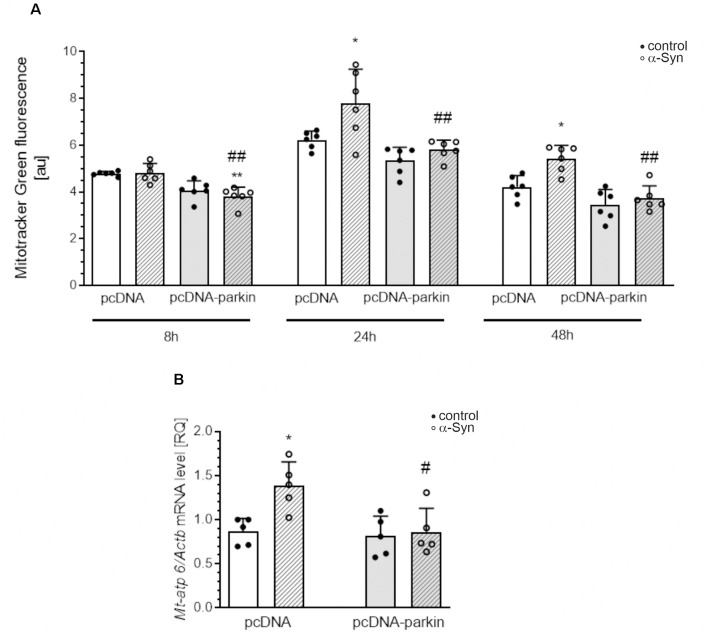
Figure 9.
Parkin deregulation induced by α-Syn treatment increases mitochondrial mass and mtDNA in PC12 cells. (A) Flow cytometry analysis and quantification of mitochondrial mass in pcDNA and pcDNA-Parkin PC12 cells treated with α-Syn for 8, 24, and 48 h at a concentration of 5 μM with mitotracker green (MTG). Data represent the mean value ± SD. for six independent experiments (n = 6). *p < 0.05, **p < 0.01 compared to pcDNA control cells; ##p < 0.01 compared to pcDNA cells treated with α-Syn, using two-way ANOVA followed by Bonferroni post hoc test. (B) mtDNA copy number in pcDNA and pcDNA-Parkin PC12 cells treated with α-Syn for 24 h at a concentration of 5 μM quantified by real-time PCR measurement of mitochondrial DNA encoded Mt-atp6 relative to the nuclear genome (Gapdh gene). Data represent the mean value ± SD for five independent experiments (n = 5). *p < 0.05 compared to pcDNA control cells; #p < 0.05 compared to pcDNA cells treated with α-Syn, using two-way ANOVA followed by Bonferroni post hoc test.

