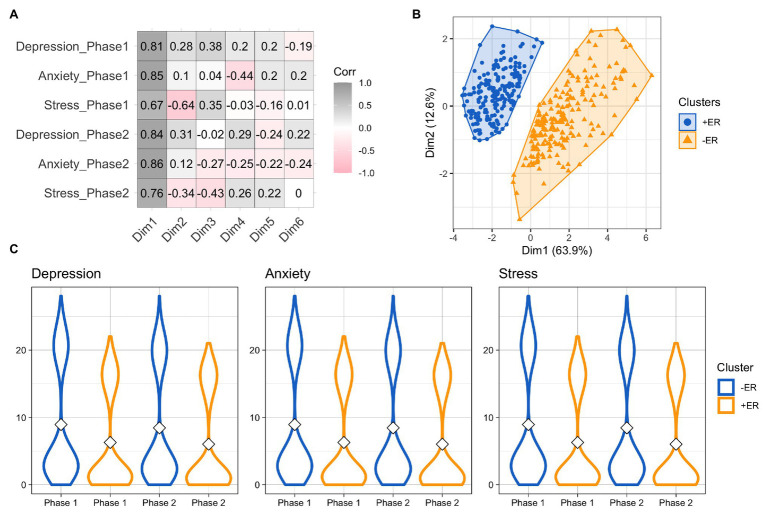
Figure 1.
(A) Correlations between the six principal components with respect to changes in depression, anxiety, and stress in the two phases. Shades of gray indicate a positive correlation, whereas shades of red indicate negative correlations. White denotes no correlation. (B) Clusters of participants identified by k-means clustering. +ER = group of participants with positive emotional response; −ER = group of participants with negative emotional response. (C) Distribution of depression, anxiety, and stress by cluster and phase.

