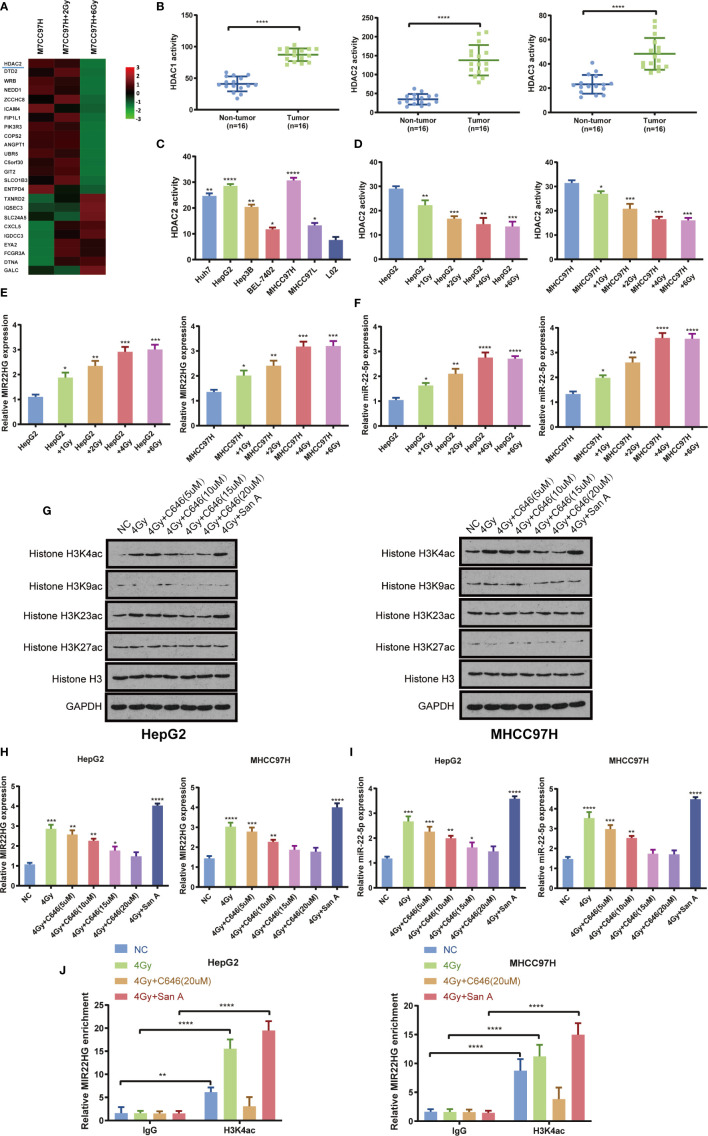
Figure 2.
(A) Microarray results indicating that HDAC2 expression in MHCC97H cells decreased significantly after irradiation. (B) HDAC1, HDAC2, and HDAC3 activity in tumor (n = 16) and non-tumor (n = 16) tissues. (C) The activity of HDAC2 in the HCC cells Huh7, HepG2, Hep3B, BEL-7402, MHCC97H, and MHCC97L and the human normal liver cells L02. *Compared with the L02 group. (D) The activity of HDAC2 in HepG2 and MHCC97H cells treated with different doses of irradiation. * Compared with the HepG2 and MHCC97H groups. (E, F) The mRNA expression of MIR22HG and miR-22-5p in HepG2 and MHCC97H cells treated with different doses of irradiation (1, 2, 4, and 6 Gy). *Compared with HepG2 and MHCC97H groups. (G) Western blot analysis of histone H3K4ac, H3K9ac, H3K23ac, H3k27ac, and H3 in HepG2 and MHCC97H cells. The treatments were irradiation of 4 Gy alone, irradiation of 4 Gy + histone acetyltransferase inhibitor C646, irradiation of 4 Gy + histone deacetylation inhibitor Santacruzamate A. (H, I) Expression of MIR22HG and miR-22-5p in HepG2 and MHCC97H cells. The treatments were irradiation 4 Gy alone, irradiation of 4 Gy + histone acetyltransferase inhibitor C646, irradiation of 4Gy + histone deacetylation inhibitor Santacruzamate A. * Compared with the NC group. (J) ChIP-PCR showing the amplified signal of the MIR22HG promoter region. The treatments were irradiation of 4 Gy alone, irradiation of 4 Gy + histone acetyltransferase inhibitor C646, and irradiation of 4 Gy + histone deacetylation inhibitor Santacruzamate A. Results showed that both irradiation and drug intervention in HDAC2 can alter amplified signals of the MIR22HG promoter region. Mean ± SD (n = 3 independent experiments). *p < 0.05, **p < 0.01, ***p < 0.001, ****p < 0.0001. San A, Santacruzamate A.

