Figure 5.
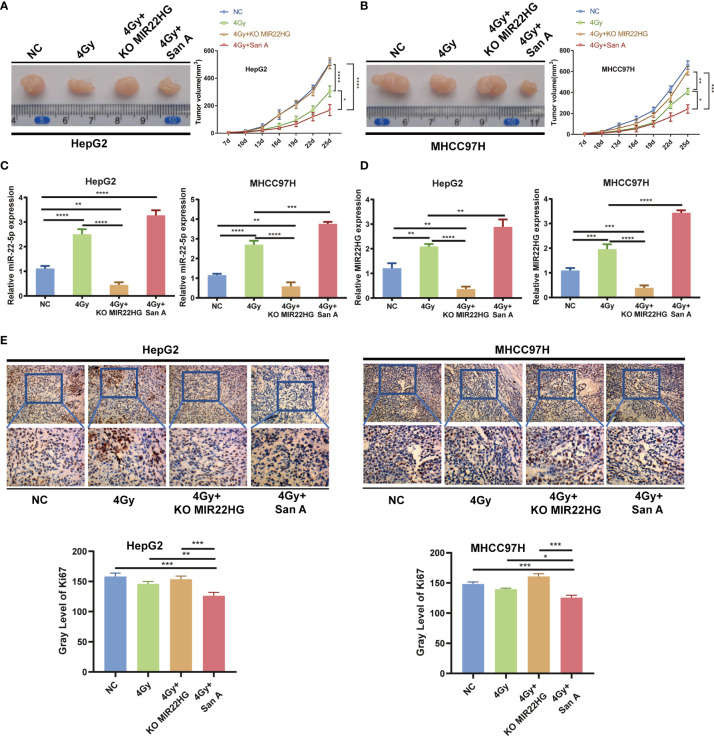
(A, B) Tumor tissues isolated from the indicated mice on day 25 post-transplant. Tumor growth curve in nude mice. After tumor cells were injected subcutaneously into the right flank of the abdomen of the nude mice, the short and long diameters of the tumors were measured every 3 days and tumor volumes (mm3) were calculated. (C, D) qPCR of MIR22HG and miR-22-5p mRNA expression in HepG2 and MHCC97H xenografts. (E) Immunohistochemistry showing the Ki67 expression of HepG2 and MHCC97H xenografts. Mean ± SD (n = 3 independent experiments). *p < 0.05, **p < 0.01, ***p < 0.001, ****p < 0.0001.

