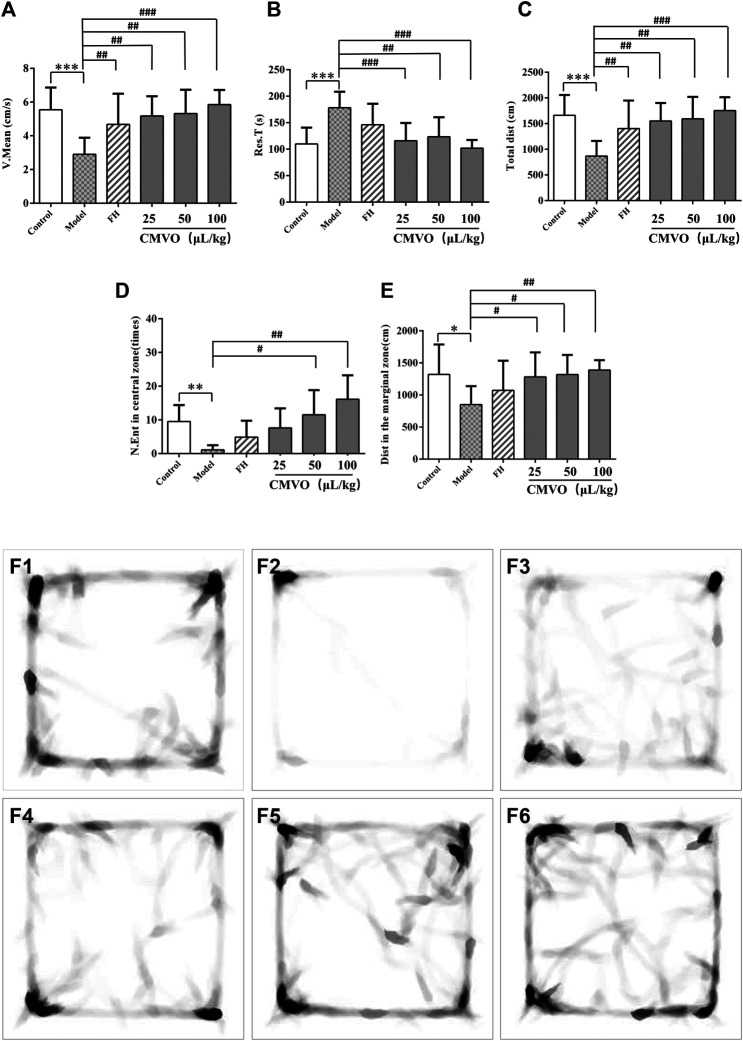
FIGURE 6.
The V.mean, Res.T, Total dist, N.Ent in central zone and Dist in the marginal zone of rats on OFT (A,B,C,D,E) and the heat map (F1‐F6) of the rat’s movement trajectory for 5 min in the open field (f1-f6). Values are expressed as (Mean ± SD, n = 8). *p < 0.05, **p < 0.01, ***p < 0.001 vs. control group. #p < 0.05, ##p < 0.01, ###p < 0.001 vs. CUMS group.

