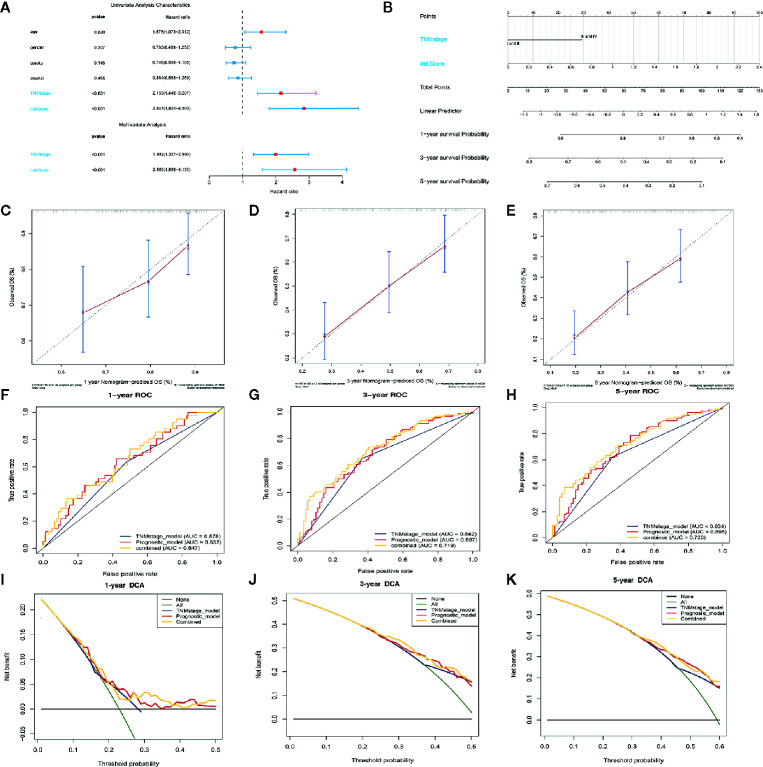
Figure 6.
Construction of the nomogram model. (A) Forrest plot showing the univariate as well as multivariate analyses indicating association of the prognostic model and clinicopathological features with overall survival. (B) The nomogram was constructed as per two independent prognostic factors for predicting OS in ESCC patients at 1, 3, and 5 years. (C–E) Nomogram calibration plots for predicting the probability of OS at 1, 3, and 5 years. (F–H) Nomogram time-dependent ROC curves for 1-,3-, and 5-year OS. (I–K) Nomogram DCA curves for 1-,3-, and 5-year OS to evaluate the clinical decision-making benefits of the nomogram.

