
FIGURE 4.
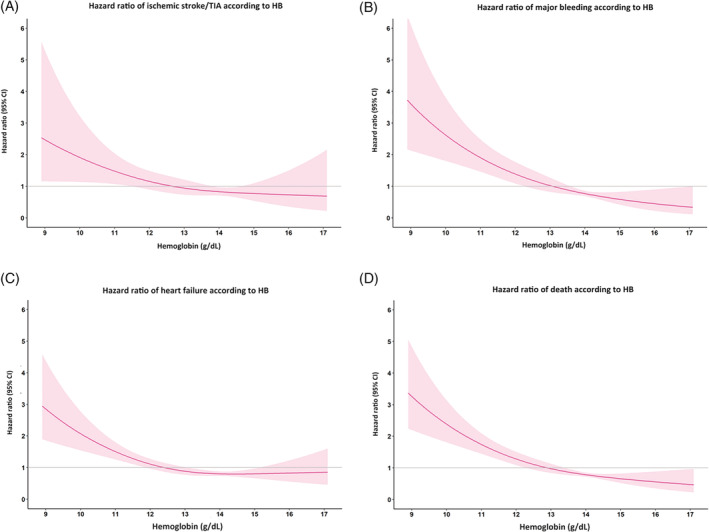
Restricted cubic spline graph showing hazard ratio and 95% confidence interval (CI) of hemoglobin (HB) as continuous data with (A) ischemic stroke/transient ischemic attack (TIA); (B) major bleeding; (C) heart failure, and, (D) death
Official websites use .gov
A
.gov website belongs to an official
government organization in the United States.
Secure .gov websites use HTTPS
A lock (
) or https:// means you've safely
connected to the .gov website. Share sensitive
information only on official, secure websites.
Restricted cubic spline graph showing hazard ratio and 95% confidence interval (CI) of hemoglobin (HB) as continuous data with (A) ischemic stroke/transient ischemic attack (TIA); (B) major bleeding; (C) heart failure, and, (D) death