
FIGURE 2.
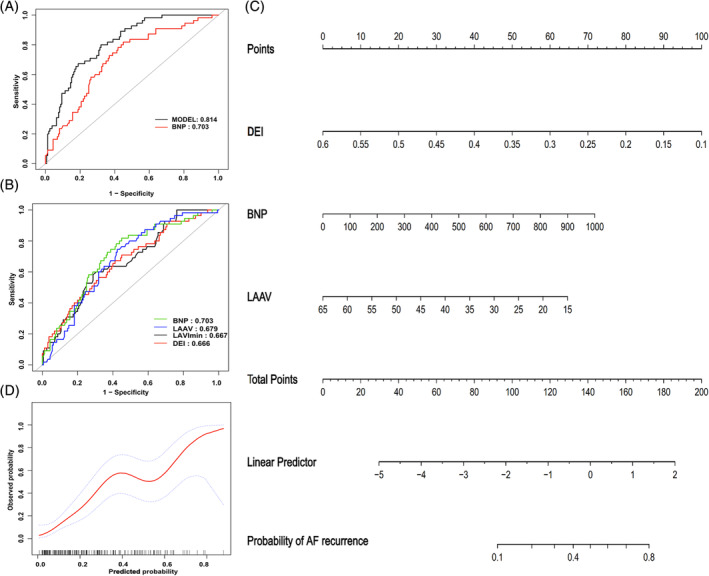
Comparison of the ROC curves of single factors (A) and Model (B) in predicting recurrence of AF;(C) The nomogram of the model in predicting the recurrence of early persistent AF after CPVA; (D) The calibration curve of the combined prediction model in predicting the probability of recurrence in early persistent AF after ablation, The horizontal axis is the predicted incidence, and the vertical axis is the actual incidence of IAC; The black line is the reference line, indicating that the predicted value is the same as the actual value; the red line is the calibration curve, and the blue area is the 95% CI of the predicted value. BNP, B‐type natriuretic peptide; DEI, diastolic ejection index; LAAV, left atrial appendage peak emptying velocity; LAVImin, minimum left atrial volume index