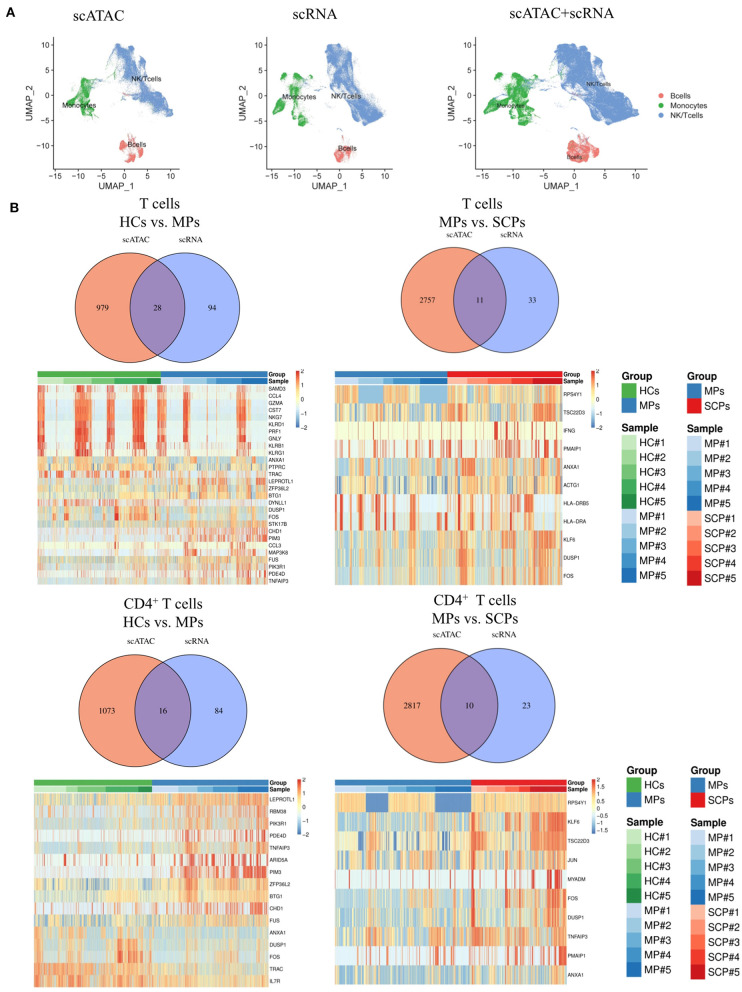
Figure 3.
Integrated analysis of scATAC-seq and scRNA-seq. (A) The integrated analysis of scATAC-seq and scRNA-seq data shows scATAC (left), scRNA (middle), and merged scATAC and scRNA by the UMAP plot using MAESTRO. (B) Venn diagram of all overlapping differential genes for scATAC-seq and scRNA-seq in total T cells and CD4+ T cells from the group of HCs vs. MPs and MPs vs. SCPs. The heatmaps of all the overlapping differential genes in the total T cells and CD4+ T cells from the group of HCs vs. MPs and MPs vs. SCPs.

