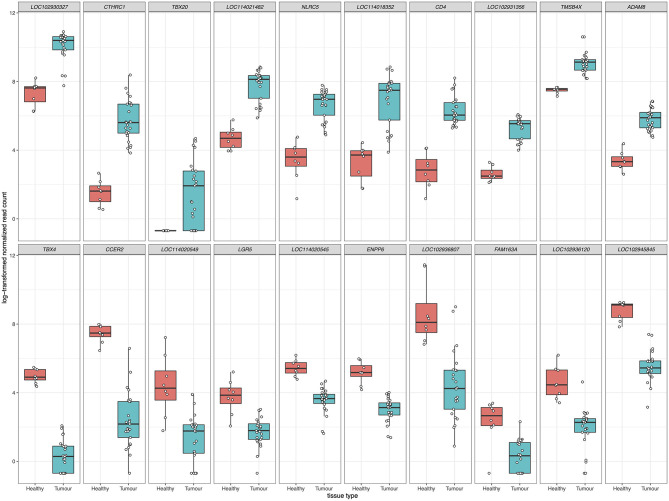
Figure 4.
The top 10 upregulated (upper panels) and downregulated (lower panels) differentially expressed genes in FP tumors. The x-axis in each plot panel separates the box plots of tissue samples into the healthy control skin group and tumor group. The y-axis plots the log2-transformed normalized read count for each sample.

