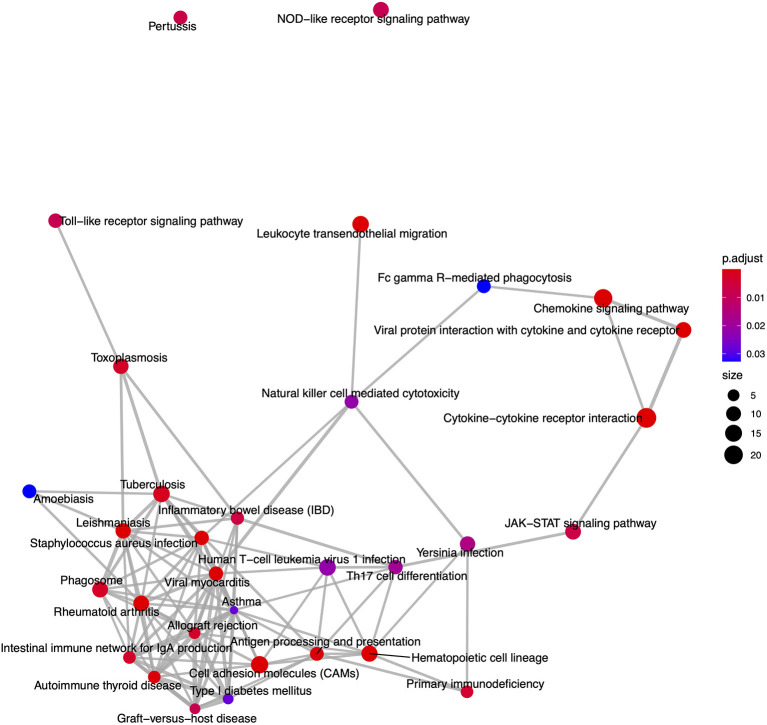
Figure 8.
An enrichment map of genes overlapping nominally significant KEGG pathways enriched among differentially expressed genes in FP. The size of each node represents the number of genes differentially expressed in that KEGG pathway, with thickness of edges between nodes representing the number of genes overlapping. Node color represents the gene set enrichment analysis test statistic with Benjamini–Hochberg adjustment for multiple testing.

