Figure 9.
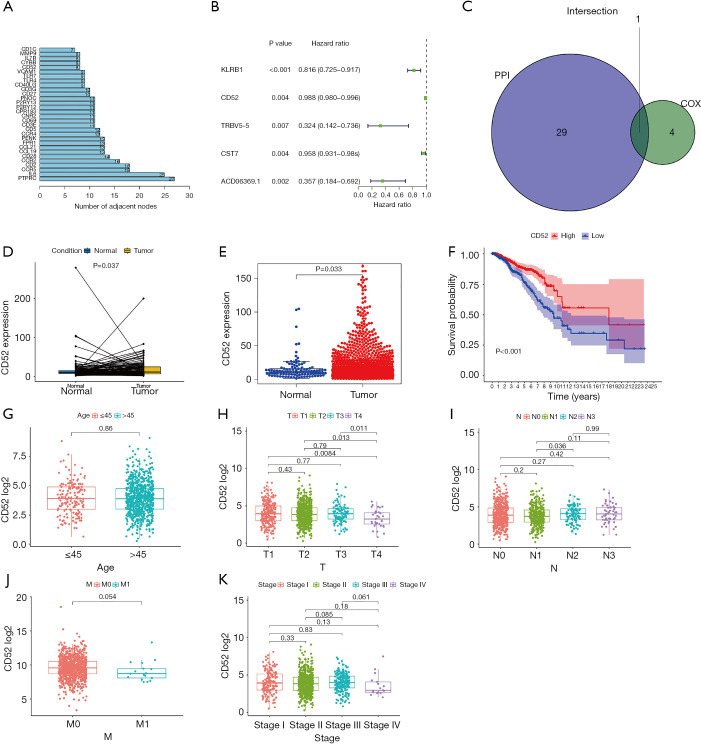
Analysis of expression and prognostic role of CD52 in breast cancer. (A) The top 30 interacting genes as identified by protein-protein interaction analysis. (B) A forest plot of the single-factor Cox regression prognostic analysis of the differential genes. (C) The intersections of the top 30 interacting genes and the Cox analysis. (D,E) A comparison of CD52 expression levels in tumor and normal samples. (F) The relationship between CD52 expression levels and prognosis of breast cancer. (G,H,I,J,K) The association between CD52 expression and clinical features.

