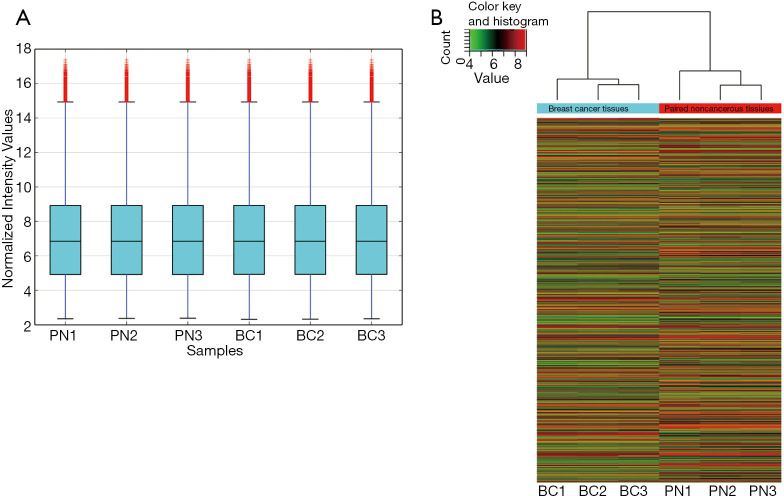
Figure 1.
Different expression of circRNAs screened by microarray in human breast tissues. (A) Distribution of the intensities of circRNAs in all tissue samples was contrasted using box plots; (B) Hierarchical clustering analysis of distinguishable circRNA expression profiles of the samples obtained from the microarray data. Each column represents one sample and each row represents one circRNA. circRNAs, circular ribonucleic acids; BC, breast cancer tissues; PN, paired noncancerous tissues.

