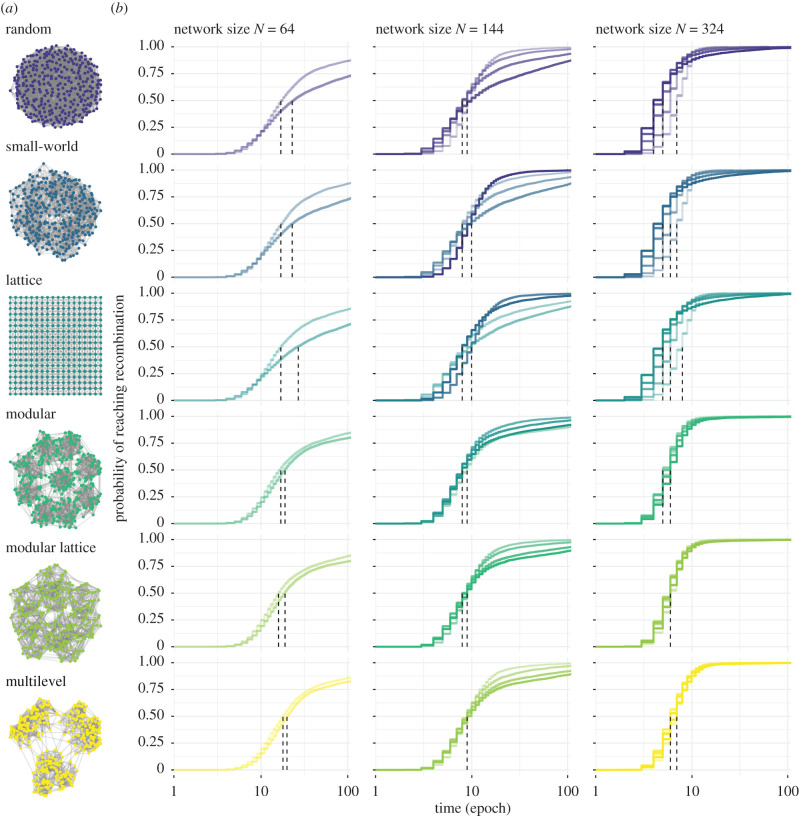
Figure 1.
Social network architectures, and the time to recombination for each architecture across population sizes and levels of connectivity using model 1. (a) Network architectures vary in clustering and modularity: Random (unclustered C = 0.03, non-modular Q = 0.24), small-world (clustered C = 0.52, medium-modular Q = 0.63), lattice (clustered C = 0.45, medium-modular Q = 0.54), modular (unclustered C = 0.23, modular Q = 0.82), modular lattices (clustered C = 0.41, modular Q = 0.81), multilevel (clustered C = 0.42, modular Q = 0.83). Each binary network depicts populations with the same number of individuals (here, N = 324 nodes) that have the same number of social connections (here, degree K = 12 links per node; density D = 0.037) but are wired differently. (b) Cumulative incidence of recombination events (y-axis) as a stepwise function over time (x-axis, log epochs) for small (N = 64), medium (N = 144) and large population sizes (N = 324). The line shading represents the amount of network connectivity (node degree K, where the lighter the shade, the smaller the degree (K ∈ {8,12} for N = 64; K ∈ {8,12,18,24} for N = 144; K ∈ {8,12,18,24,30} for N = 324). Vertical dashed lines indicate the median of time to recombination (S(t) ≤ 0.5) per network connectivity, across architectures. The time to reach recombination was truncated to 100 epochs for better visualization. Curves were calculated based on 5000 simulations. (Online version in colour.)

