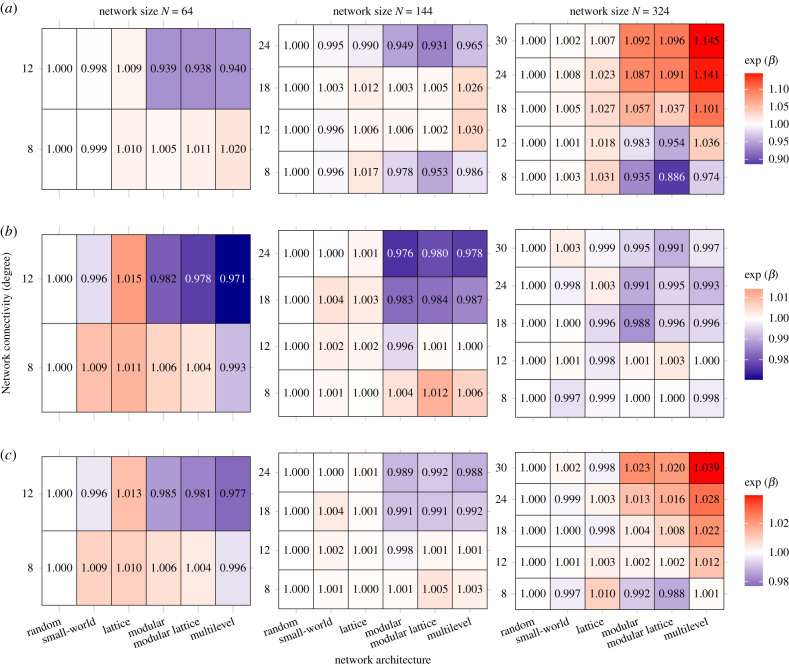
Figure 3.
Relative performance of network architectures within each of the 11 combinations of population size and level of connectivity used in the simulations. Each row of each table reports the coefficient estimate of GLMs of network architecture (column) in function of the time to recombination while maintaining degree (row) and network size (box) constant. Higher coefficients (red colours) represent a poorer performance (longer latency to recombination) while lower coefficients (blue colours) represent architecture that perform better (shorter latency to recombination) for that combination of population size and level of connectivity (using random networks as the reference architecture in the GLM intercept). The relative performance of each architecture is shown for (a) time to recombination under a one-to-many diffusion mechanism (model 1), (b) time to recombination under a one-to-one diffusion mechanism (model 2) and (c) total time to diffusion (from simulation start until the majority of the population has information about the final higher-payoff product) under a one-to-one diffusion mechanism (model 2). (Online version in colour.)

